Durability and Performance Rating Procedures for Plastic Gears
High-performance plastic gears are increasingly replacing metal gears in several applications due to the many advantages they exhibit. The main ones are lower weight, no need for lubrication, cheaper mass production, significantly better noise, vibration and harshness (NVH) behavior and chemical/corrosion resistance. Most plastic gears are produced by injection molding, which enables great design flexibility, e.g., joining several machine elements into one molded part, while gear geometry modifications like enlarged root rounding or altered profile shapes are also possible (Ref. 1).
Plastic gears have been used since the 1960s, when they were initially used for simple motion transmission applications. Over the years, with the development of new, improved plastic materials, technology started to make its way into power transmission applications. Until recently, plastic gear drives were employed for applications with power up to 1 kW; however, lately, there have been attempts to use high-performance plastics in gear drives exceeding the 10-kW mark.
Along with ever-increasing customer requirements, the NVH behavior of polymer gears is also gaining importance. One of the early studies of the acoustic performance of polymer gears was carried out by Hoskins et al. (Ref. 2), in which the researchers examined the influence of diverse materials used in polymer gears and different operational circumstances on the spectrum of sound frequencies. Parameters such as the texture of the surface, wear, and temperature, stemming from the interaction between tooth surfaces, were recognized as the factors affecting the intensity of sound energy. Trobentar et al. (Ref. 3) compared the acoustic behavior of polymer gears with different tooth profiles, i.e., involute and S-gears. The tooth profile of the S-gears had a convex addendum and concave dedendum, which resulted in a progressively curved (in the shape of the letter S) path of contact. The authors found that S-gears exhibit lower noise than involute gears, which can be attributed to the more favorable contact conditions. Polanec et al. (Ref. 4) studied the noise of coated POM polymer gears. Three physical vapor deposition (PVD) coatings were investigated, i.e., aluminum, chromium, and chromium nitrite. The study revealed that uncoated polymer gears exhibited the lowest sound pressure level, and hence no positive impact of the coating on the reduced noise could be confirmed. Furthermore, the coating started to peel off during operation, causing increased friction and meshing disturbances, which resulted in an increased sound-pressure level.
The broader adoption of polymer gears could be facilitated if standardized design methodologies were established and pertinent material information became accessible. Presently, there is a lack of a global norm that would formalize the calculations, design principles, and recommendations specific to polymer gears. Certain national standards on this topic do exist, for instance, BS 6168:1987 (Ref. 5), as well as the Japanese standard JIS B 1759:2013 (Ref. 6). The latter draws from ISO 6336:2006 (Ref. 7) with some adaptations detailed in Moriwaki et al.’s study (Ref. 8). Additionally, guidelines from diverse engineering associations are at one’s disposal. VDI 2376:2014 (Ref. 9), a successor to VDI 2545 (Ref. 10), was published in 2014, stands as the most comprehensive and commonly employed framework for polymer gear design. It encompasses evaluation techniques for the most recurrent failure modes in polymer gears. Fundamental material data for substances like POM and PA 66 are also encompassed. AGMA (Refs. 11,12) has also issued design guidelines, though these focus solely on potential materials and gear configurations, neglecting design models and essential material data crucial for polymer gear design. Tavčar et al. (Ref. 13) introduced a holistic design optimization for polymer gears that encompasses all plausible failure modes. Efforts have also been made to incorporate machine-learning algorithms into gear design (Refs. 14,15), which have proven beneficial for evaluating non-standard gear designs. Nonetheless, a substantial database of existing instances is requisite to adequately train such models.
When compared to steel gears, polymer ones do also have some disadvantages. The most important ones are a lower load-bearing capacity, poorer thermal conductivity, less temperature stability, and poorer manufacturing precision. While the load-bearing capacity is the most important property, several studies have been conducted that relate to improving it, either with a special gear design (Refs. 1,16,17) or improved materials (Refs. 18,19,20). It is speculated that a significant contribution to the load-bearing capacity can also be applied with sufficient quality of the molded gears. While there are studies available discussing the effects of processing parameters (Ref. 21) and tool design on the geometric quality of injection-molded gears, there is a lack of systematic studies addressing these effects on the mechanical and thermal responses of polymer gears.
An extremely wide selection of different plastic materials is currently available on the market. A major limitation, however, is a huge gap in gear-specific material data on these materials, which is a problem that has been persisting for decades now. Providing a step towards a solution is the German guideline VDI 2736, which proposes design rating methods (Ref. 9) along with testing procedures (Ref. 22) to be followed to generate reliable data required in the gear rating process. This paper delves into the current state of the art in plastic gear testing, providing a comprehensive overview of testing methods and supplemented with case studies.
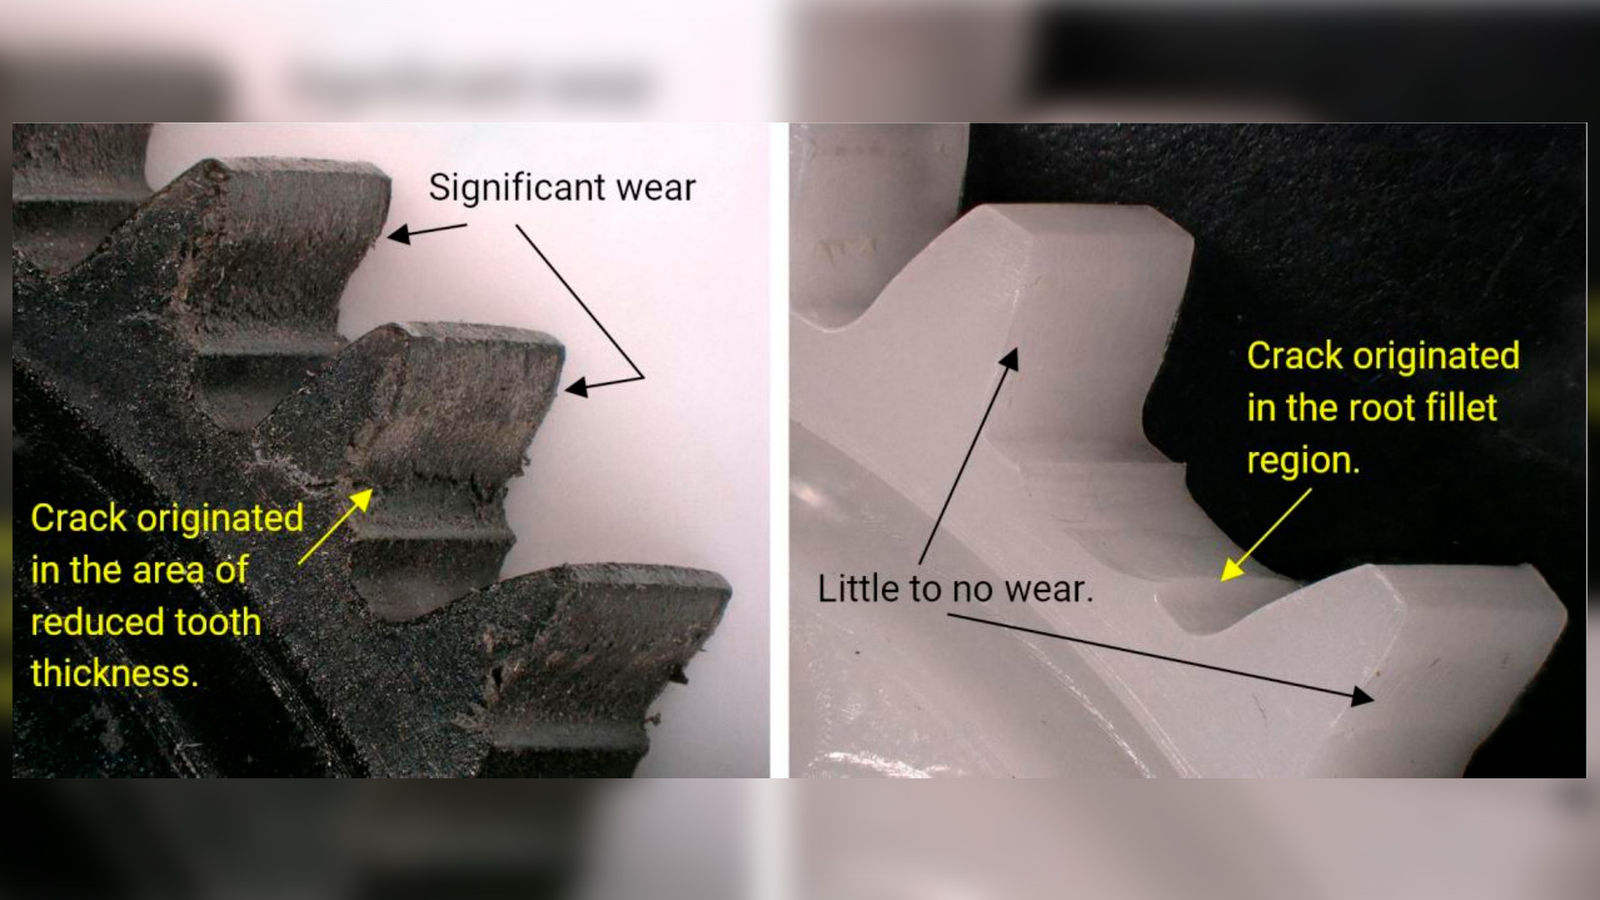
To ensure reliable operation of the gearbox, each gear needs to be appropriately designed to avoid failure within the required lifespan and operating conditions. Plastic gears can fail due to different failure modes, i.e., fatigue fracture, wear or plastic deformation, which is usually thermally induced. Examples of the possible failure modes are shown in Figure 1. The fatigue failure mode can result in root fracture (Figure 1a), flank fracture, or, in some cases also pitting. Out of the three, the most common fatigue failure mode is root fracture, while flank fracture is often correlated with unfavorable contact characteristics of the gear pair, and pitting was only observed in some oil-lubricated cases. Wear, shown in Figure 1b, is another common failure mode for plastic gears. The degree of wear the gear exhibits depends on a variety of factors, e.g., operating temperature, lubrication, load, material of the mating gear, etc. Notable wear of the flank profile, deviating from the involute shape, leads to an elevated level of transmission error and worse NVH performance. As the wear progresses significantly, it also results in the breaking of teeth, with cracks originating from the worn tooth profile. The acceptable extent of wear varies depending on the specific use case. In applications demanding high precision (such as robotics and sensors), minimal wear is permissible, whereas in applications with lower precision requirements (like household appliances, power tools, and e-bike drives), a relatively substantial degree of wear is acceptable, involving a reduction in tooth thickness within the range of 20–30 percent of the gear module.
Figure 1—Possible failure modes for plastic gears: a) root fatigue, b)wear, c) plastic deformation due to thermal overload.
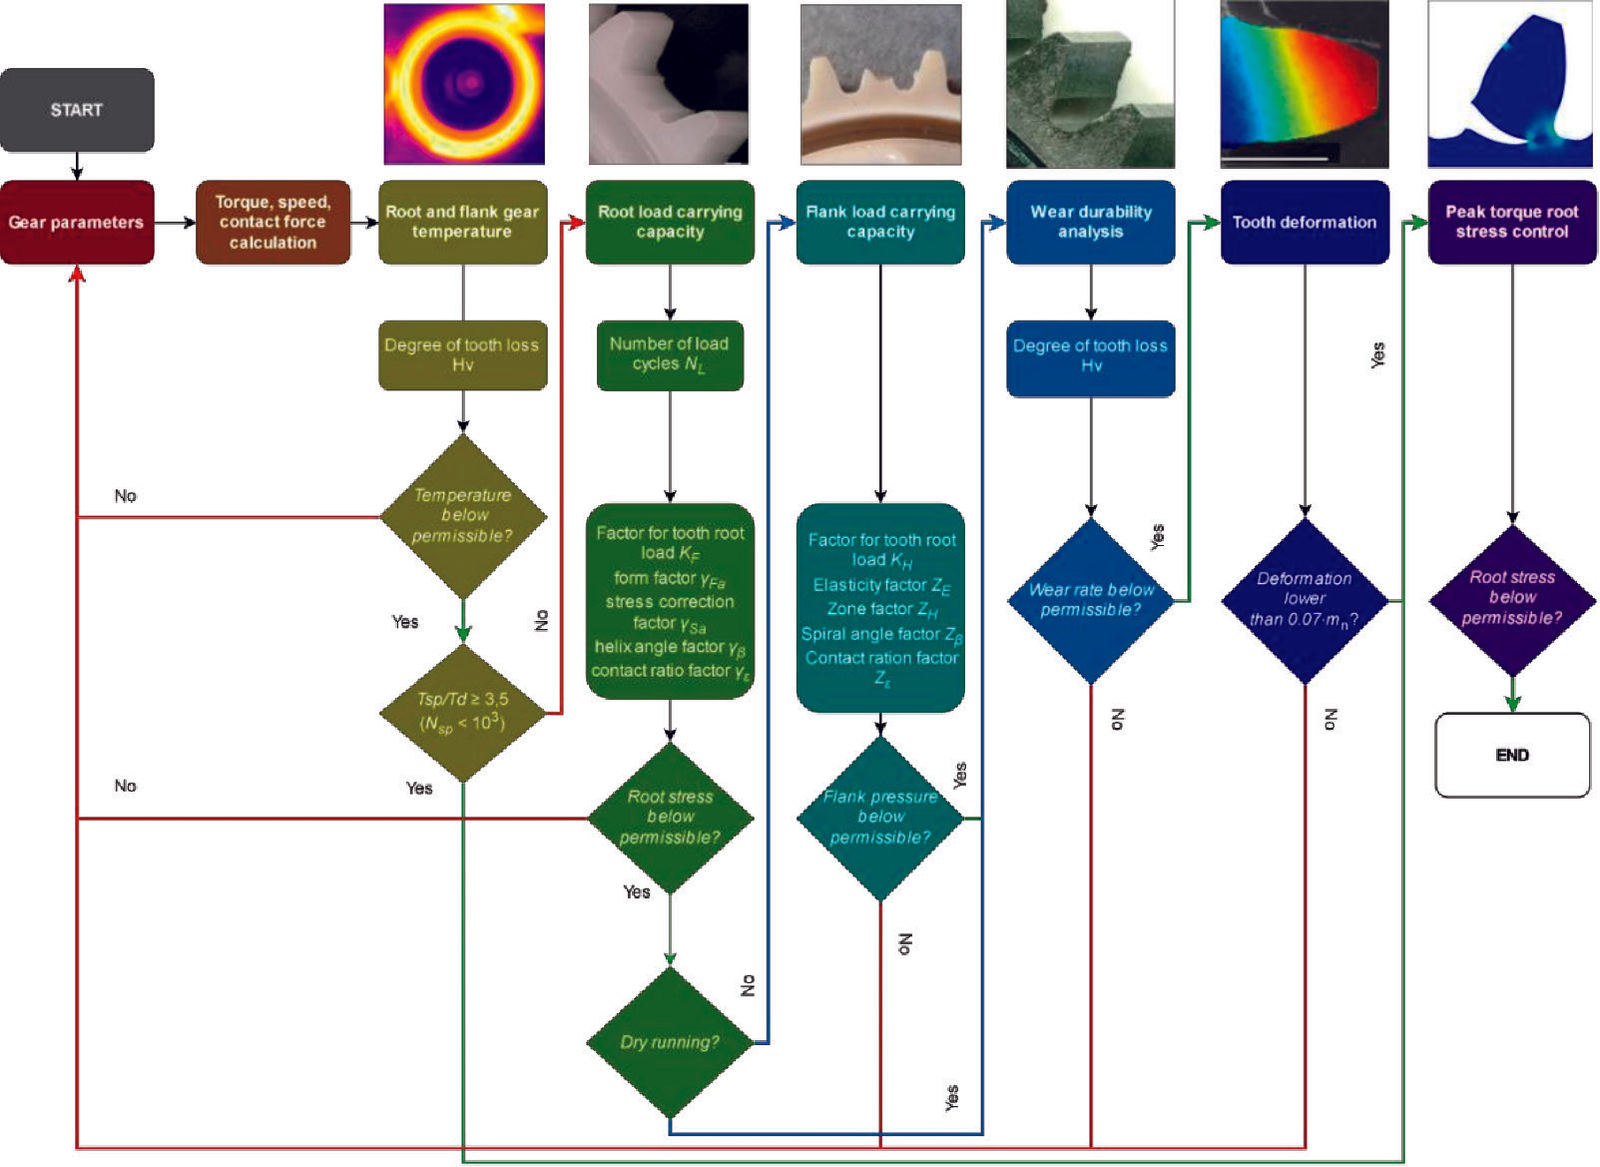
There is currently still no international standard available for the mechanical design of plastic gears, which would provide all the required tools and rating procedures to conduct design control against all possible failure modes. The most up-to-date and comprehensive is the German guideline VDI 2736: Part 2 (Ref. 9), where the design rating procedures for each failure mode are proposed. A flowchart representing the entire failure mode control process is shown in Figure 2. While the proposed procedures are feasible, the real problem arises as each control model requires some gear-specific material data, which is very limited. To patch this problem, VDI 2736: Part 4 (Ref. 22) provides testing procedures on how to generate the required material data.
Figure 2—Failure mode control process within the plastic gear’s design phase as recommended by the VDI 2736: Part 2 guideline for cylindrical gears.
Step 1. Calculate the operating temperature for the gear pair under design
To ensure the reliable operation of a plastic gear, its operating temperature needs to be lower than the permissible temperature for a continuous load. The coefficient of friction for the selected material pair is needed in this step to be able to calculate the heat generated by friction.
Step 2. Root strength control
The actual stress in the tooth’s root needs to be lower than the material’s fatigue limit at the desired number of load cycles (1 rotation of the gear is 1 load cycle on each tooth). Knowledge of the material’s fatigue strength is required to complete this step.
Step 3. Flank strength control against pitting
This step is usually performed only for plastic gear pairs running in oil, as this is the only operating condition where pitting on plastic gears is sometimes observed. For dry-running or grease-lubricated plastic gears, root fatigue or wear are the most frequent failure modes.
Step 4. Wear control
[advertisement]
Needs to be conducted for dry running plastic gears. It is recommended to do this control step also for grease-lubricated plastic gears if the plastic material is reinforced with fibers. Pulled out and cracked fiber particles tend to mix with the grease, forming an abrasive medium. The wear factor for the material pair of choice is required to conduct this step.
Step 5. Teeth deflection control
Excessive deflection of teeth should be avoided to prevent teeth jamming and irregular meshing. Elastic modulus is required in this step to be able to calculate the tooth’s deflection.
Step 6. Control of the static load
In some applications, the gears are loaded with a high static load, e.g., holding some weight in a defined position. In that case, the gears need to be rated against a static load, and knowledge of the material’s tensile strength is required.
It is not necessary to always conduct all the design rating steps. Step 1, Step 2 and Step 4 are advised to be always conducted, while others are case dependent.
Gear’s Operating Temperature
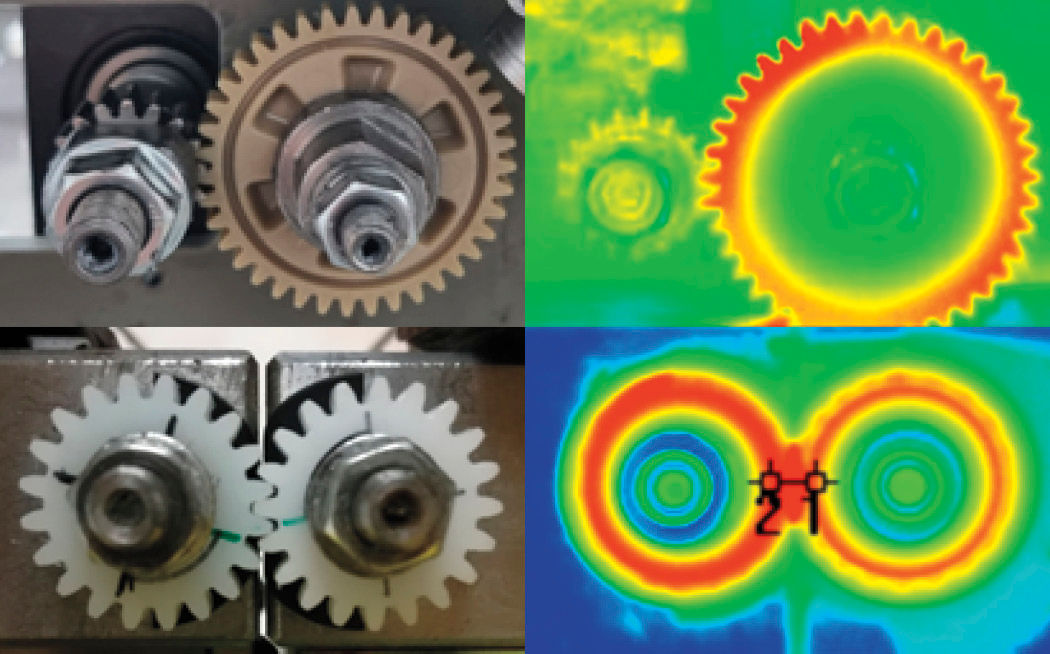
Gears heat up during operation. An exemplary temperature measurement conducted by a thermographic camera is shown in Figure 3. Friction between the meshing teeth and hysteretic effects are the main reasons for the temperature increase in plastic gears. The rate of heat generation and the resulting temperature rise depend on several factors, e.g., torque, rotational speed, coefficient of friction, lubrication, thermal conductivity, convection, gear geometry, etc. To ensure the reliable operation of a plastic gear, its operating temperature needs to be lower than the material’s permissible temperature for a continuous load.
Figure 3—a) Thermal image of a Steel/Plastic gear pair during operation,b) Thermal image of a Plastic/Plastic gear pair.
The first rating point for plastic gears is the prediction of the operating temperature to ensure no thermal overload (Figure 1c) occurs under the specified operating conditions. The VDI 2736 guideline employs a slightly supplemented Hachmann-Strickle model (Ref. 23), which was presented in the 1960s. The Hachmann-Strickle model was later supplemented by Erhard and Weiss (Ref. 24). The guideline goes further and proposes a model for calculating the temperature in the tooth’s root:
(1)
and on the flank:
(2)
Evidently, the equations are almost the same, as there is difference only in one factor, the kj, where the guideline provides different values for the root region and the flank region. In the proposed equation the most important factor is the coefficient of friction, which is dependent on several parameters, e.g., material combination, temperature, load, lubrication, sliding/rolling ratio, siding speed, etc.
The VDI model is analytic and easy to use, while the accuracy of results is limited. Several scientific studies, e.g., Fernandes (Ref. 25), Casanova (Ref. 26), Černe (Ref. 27), were presented recently which dealt with this topic and each one proposed different, advanced, numerically based temperature calculation procedures.
Root Stress Control
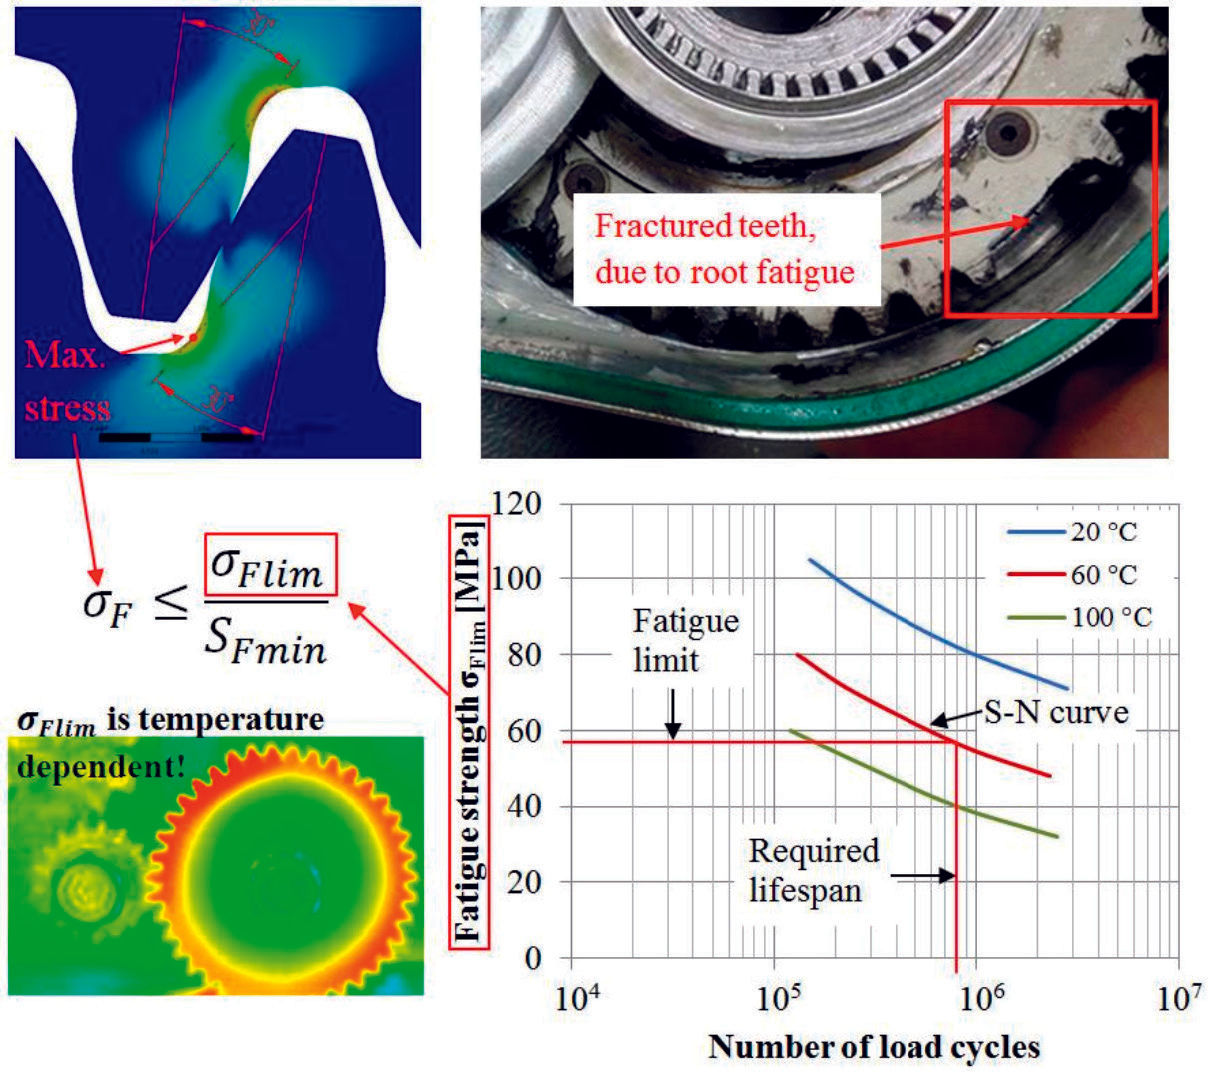
To avoid root fatigue fracture, which is a fatal failure, the root stress σF in a gear needs to be lower than the material’s fatigue strength limit σFlim for the required operating lifespan (Figure 4). To account for unexpected effects some additional safety SF is usually also included.
(3)
To calculate the root stress, the VDI 2736 guideline proposes the same equation as provided by the DIN 3990 (Method C) (Ref. 28), which is a standard for steel gears:
(4)
The guideline further simplifies the equation by assuming that for plastic gears, if the condition b/m≤12 is met, the root load factor can be defined as KF=KA∙KV∙KFβ∙KFα≈1….1.25.
While Equation 4 is simple to use and familiar to any gear design engineer, the major drawback is that it does not account for the load-induced contact ratio increase, hence overestimating the actual root stress values. A more accurate root stress calculation can be achieved by employing numerical manners, e.g., by FEM simulation. FEM-based methods are, however, labor and cost-intensive.
Assuming the root stress for the gear design under evaluation is calculated, it needs to be compared to a fatigue limit σFlimwhich is a material property and needs to be characterized by extensive gear testing on a dedicated test bench. For plastic materials, the σFlim is temperature dependent; therefore, several S-N curves generated at different gear temperatures are required (Figure 4).
Figure 4—Temperature-dependent S-N curves are needed to conductroot strength control.
Flank Pressure Control
Flank fatigue failures have been observed mostly in oil-lubricated applications with plastic gears. Assuming the operating temperature does not exceed the limit temperature for continuous operation, in dry running conditions, plastic gears usually fail due to root fatigue or wear. Thus, for dry running conditions, this step is not included, as it is expected that the wear of flanks will be much more severe than the flank fatigue. To avoid flank fatigue failure in lubricated contacts, the flank pressure σH needs to be lower than the material’s fatigue strength limit σHlim for the required operating lifespan. To account for unexpected effects, some additional safety SH is usually also included.
(5)
To calculate the flank pressure the VDI 2736 guideline again proposes the same equation as provided by the DIN 3990 standard:
(6)
if the condition b/m≤12 is met, the same simplification as in root stress calculation applies also to the flank load factor KH=KA∙KV∙KHβ∙KHα≈1….1.25.
Once the flank pressure for the gear design under evaluation is calculated, it needs to be compared to a fatigue limit σHlim which is a material property and needs to be characterized by extensive gear testing on a dedicated test rig. For plastic materials, again, the σHlim is temperature dependent; therefore, several S-N curves, with flank fatigue as a failure mode, generated at different gear temperatures, are required.
Wear Control
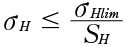
Wear is a common damage mode for dry runs and some grease-lubricated applications with plastic gears. It can lead to a fatal failure where teeth are worn to the degree that they break instantly under load or that fatigue cracks originate at the worn section (Figure 5a). The wear of plastic gears, in the final stages, leads to fracture (assuming gears are not replaced before). The crack initiation location in such cases often differs from what is expected of a classic root fatigue failure mode (Figure 5b). Due to the reduced tooth thickness, stress concentration and, consequently the crack initiation location can be often found higher in the dedendum area, in the region where the active tooth flank starts. In several applications, the gears might not have failed; however, they do not fulfill the application requirements if they are worn to an acceptable degree, e.g., in high-precision applications. The following equation:
(7)
is proposed by the VDI 2736 guideline for wear control. The only material-dependent parameter is the wear factor kw which considers the wear properties of the material pair under evaluation. It is important to note that the wear behaviour of plastic gears is dependent on both materials in the pair.
Figure 5—a) Severe wear, leading to fatigue-induced cracks at the worn section of the tooth profile, b) Root fatigue failure mode—crack originates in the filleted root section.
Agile Gear Design Methodology
The design rating procedures presented in the preceding subsections provide valuable tools that enable the evaluation of gear designs against all possible failure modes. Such rating procedures are possible if all the required material data is available, which usually is not. When starting with a new gear drive design utilizing plastic gears, we often face several questions:
Which materials should be used?
Dry run or lubrication (which lubricant to use)?
Are we getting the best performance out of the current plastic gear design?
Will the gears survive the req. lifespan without a decrease in performance or failure?
Will the drive’s characteristics and efficiency be as requested?
Will the drive’s NVH behavior be satisfactory?
Those questions can be successfully addressed by employing the below presented agile gear design methodology. An agile model for the design of gearboxes with plastic gears, as shown in Figure 6, was formulated based on more than a decade of practical experience. The proposed design methodology has several test stages, resulting in a reduced number of tests and providing reliable material data for the rating procedures of gears for various applications.
Figure 6—Agile development process for gearboxes with plastic gears.
The procedure consists of several steps:
Preliminary gear design based on the input data (material selection, simple design calculations for the gears). If the selected polymer material pair already has known material properties, the procedure can be continued with Stage 3.
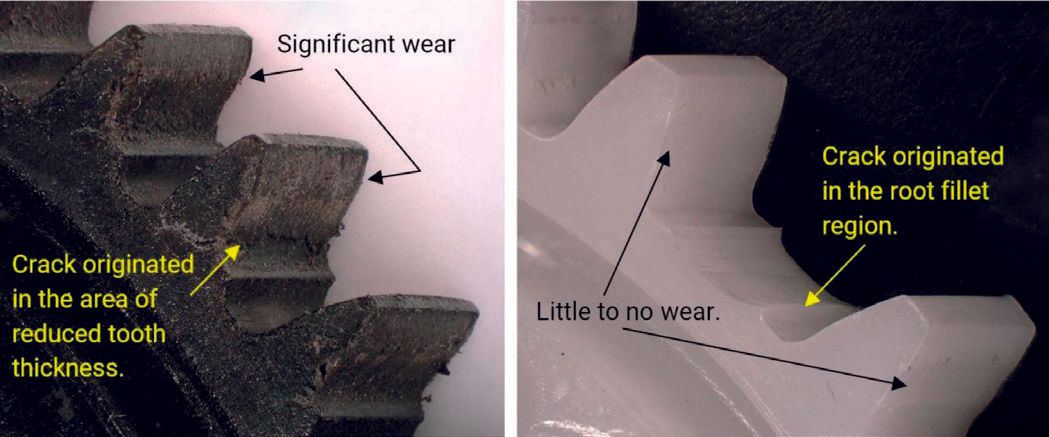
For initial material screening, accelerated (step) tests can be employed (Figure 7). These enable the evaluation of a large set of different materials (or material pairs) in a rather quick and cost-efficient way. Such tests need to be conducted in precisely controlled operating conditions. Usually, the torque is increased in steps until the final gear failure, and the rotational speed is kept constant. When dealing with plastics, the operating temperature is a highly important parameter. In step tests, there are two possibilities, depending on what the research focus is.
If the focus is to compare the material’s load-bearing capacity under fatigue load, it is better if the plastic gear’s temperature is controlled.
If the focus is to study tribological behavior, it is more convenient to let the gear pair evolve its operating temperature. This way, material combinations that exhibit a lower friction can be identified. By employing the same approach, different lubricants can also be evaluated and the best one for your gear application can be selected.
When the best performing materials are identified, they are further tested to generate S-N curves and characterize wear factors. Once available, this data will enable a reliable and optimized gear design with the best possible material utilization.
Detailed calculation and design of polymer gears: Well-defined material properties (Stage 2) enable the reliable calculation of gears. This reduces the number of prototypes required.
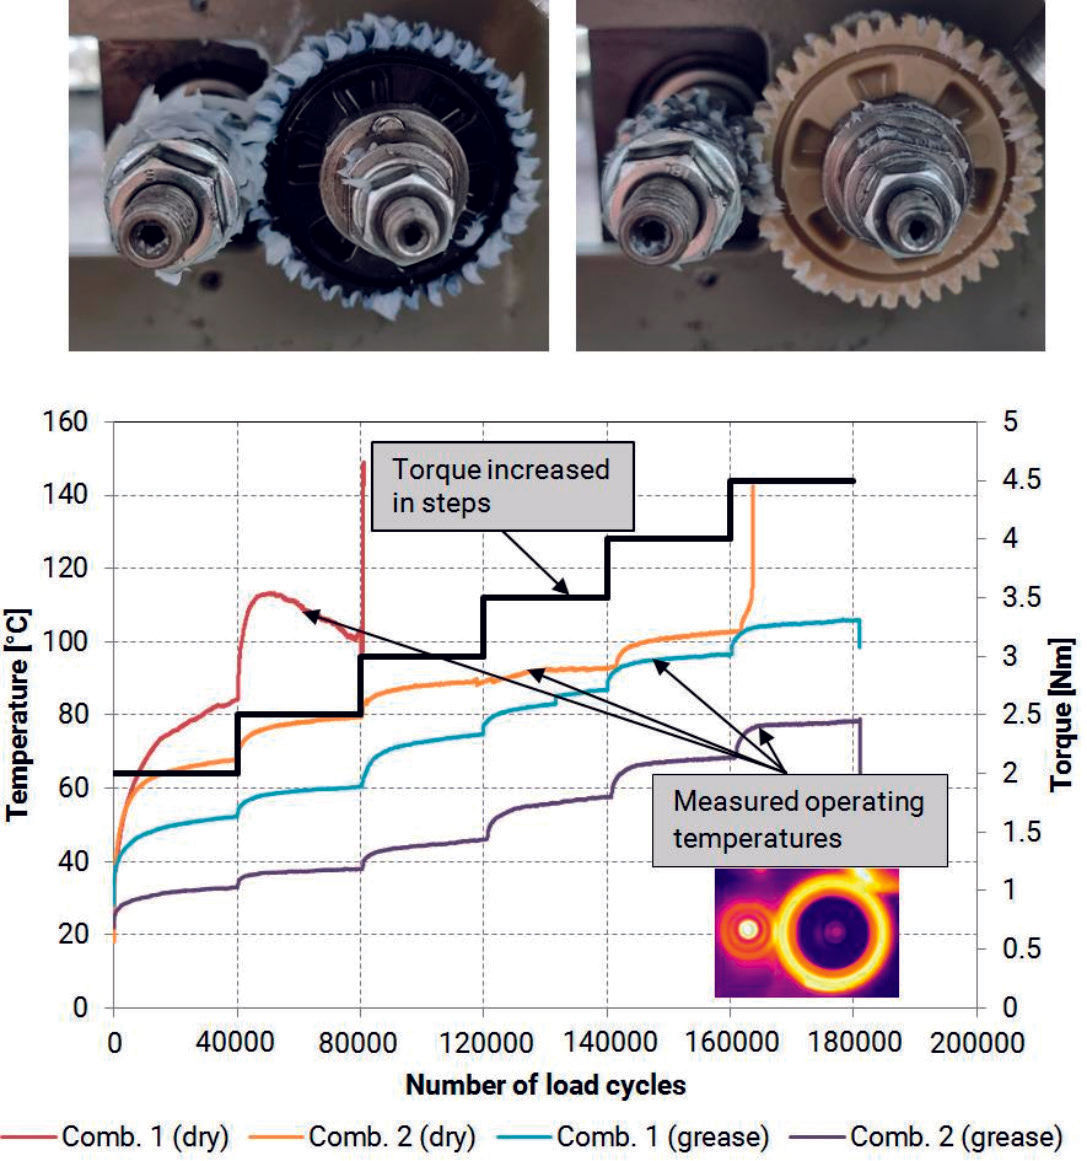
Testing of gears in the final application—product validation, as shown in Figure 8. The production of tools for injection molding is expensive and time-consuming. It is important to do all the previous steps well and produce the tools only once.
Figure 8—Validation on the final application.
Testing Methodologies—Generation of Crucial Material Data
A complete overview of the current state-of-the-art testing methods is provided in the following sections. Where applicable, problems are highlighted and solutions proposed. All the presented results were generated on the [Anonymized] test bench by testing the VDI 2736 size 1 geometry gear pairs (see Table 1).
Test Sample
To complete each control step for a possible failure mode, as presented in Figure 2, gear-specific material data is required. This data is obtained by dedicated gear testing methods. Currently, there are no standardized test procedures available that could be employed to generate this data. The most up-to-date is VDI 2736: Part 4 (Ref. 22), which provides comprehensive recommendations for the testing methodology. As per the guideline, three gear geometries are proposed for experimental characterization. The proposed gear parameters are presented in Table 1. Being closest to most practical applications with plastic gears, the Size 1 geometry is most used for testing. The lack of standardization results in several other gear geometries being dealt with in scientific and technical reports. It is, however, extremely important for the development of future plastic gear rating standards that the test sample geometries are unified similarly as in most comparable standards dedicated to the characterization of a material’s mechanical properties.
The gear’s manufacturing quality affects the stress state in the gear when under load (Ref. 29). Controlling the test samples’ production quality is equally important for a reliable comparison of test data. The gear manufacturing quality is usually evaluated according to ISO 1328 (Refs. 30,31). For material characterization purposes, gears with most rating parameters in quality 10 (or better) are recommended for testing. Besides the gear’s geometrical quality, even more important is that the gears are produced without any significant weld lines and voids. If during gear testing, failure occurs on the weld line or at a void location, the test result is not a function of a material property but rather of the defect in the gear because of a bad-quality sample production. Since the gear tests are used to generate gear-specific data on the material properties, failure should be a single function of the material’s performance.
Parameter
Nomenclature
Unit
Size 1
Size 2
Size 3
Type of gear
/
/
spur gear
spur gear
spur gear
Centre distance
a
mm
28
60
91.5
Normal module
mn
mm
1
2
4.5
Number of teeth
z1/z2
/
17/39
30/30
16/24
Gear’s face width
b1/b2
mm
8/6
13/12
22/20
Pressure angle
αn
°
20
20
20
Tip diameter
da1max/da1min
mm
19.40/19.35
64.916/64.779
82.45/82.36
da2max/da2min
mm
40.40/40.30
63.098/62.902
118.35/118.26
Root diameter
df1max/df1min
mm
14.902/14.610
55.916/55.779
61.917/61.215
df2max/df2min
mm
35.866/35.691
54.498/54.301
97.824/97.122
Table 1—Test gear geometries, as proposed by the VDI 2736: Part 4 (Ref. 22).
Test Rigs
There are three main test rig layouts used for gear testing. The back-to-back test rig, presented in Figure 9, is a very well-known concept that has been widely used for the testing of steel gears. For the testing of plastic gears, the basic concept of this test rig has some limitations. In a back-to-back test rig, the torque on the tested gear pair is applied by a rotational displacement of a loading clutch. Plastic gears deflect under load significantly more than steel ones. Due to the teeth deflection, some of the torque applied with a rotational displacement of the loading clutch is lost. Additional torque loss occurs during the test duration due to the viscous properties of plastic materials and additional deflection of teeth due to creep. As plastic gears wear quite significantly during operation, another portion of torque loss occurs due to tooth wear. This problem can be solved by applying a continuously adjustable electromechanical or hydraulic torque application system, which significantly complicates the test rig’s design and control, adding to the overall cost of the test rig. Another disadvantage when it comes to gear testing is that the center distance is fixed and determined by the master gear pair.
Figure 9—Schematic representation of a closed-loop, back-to-back gear test rig.
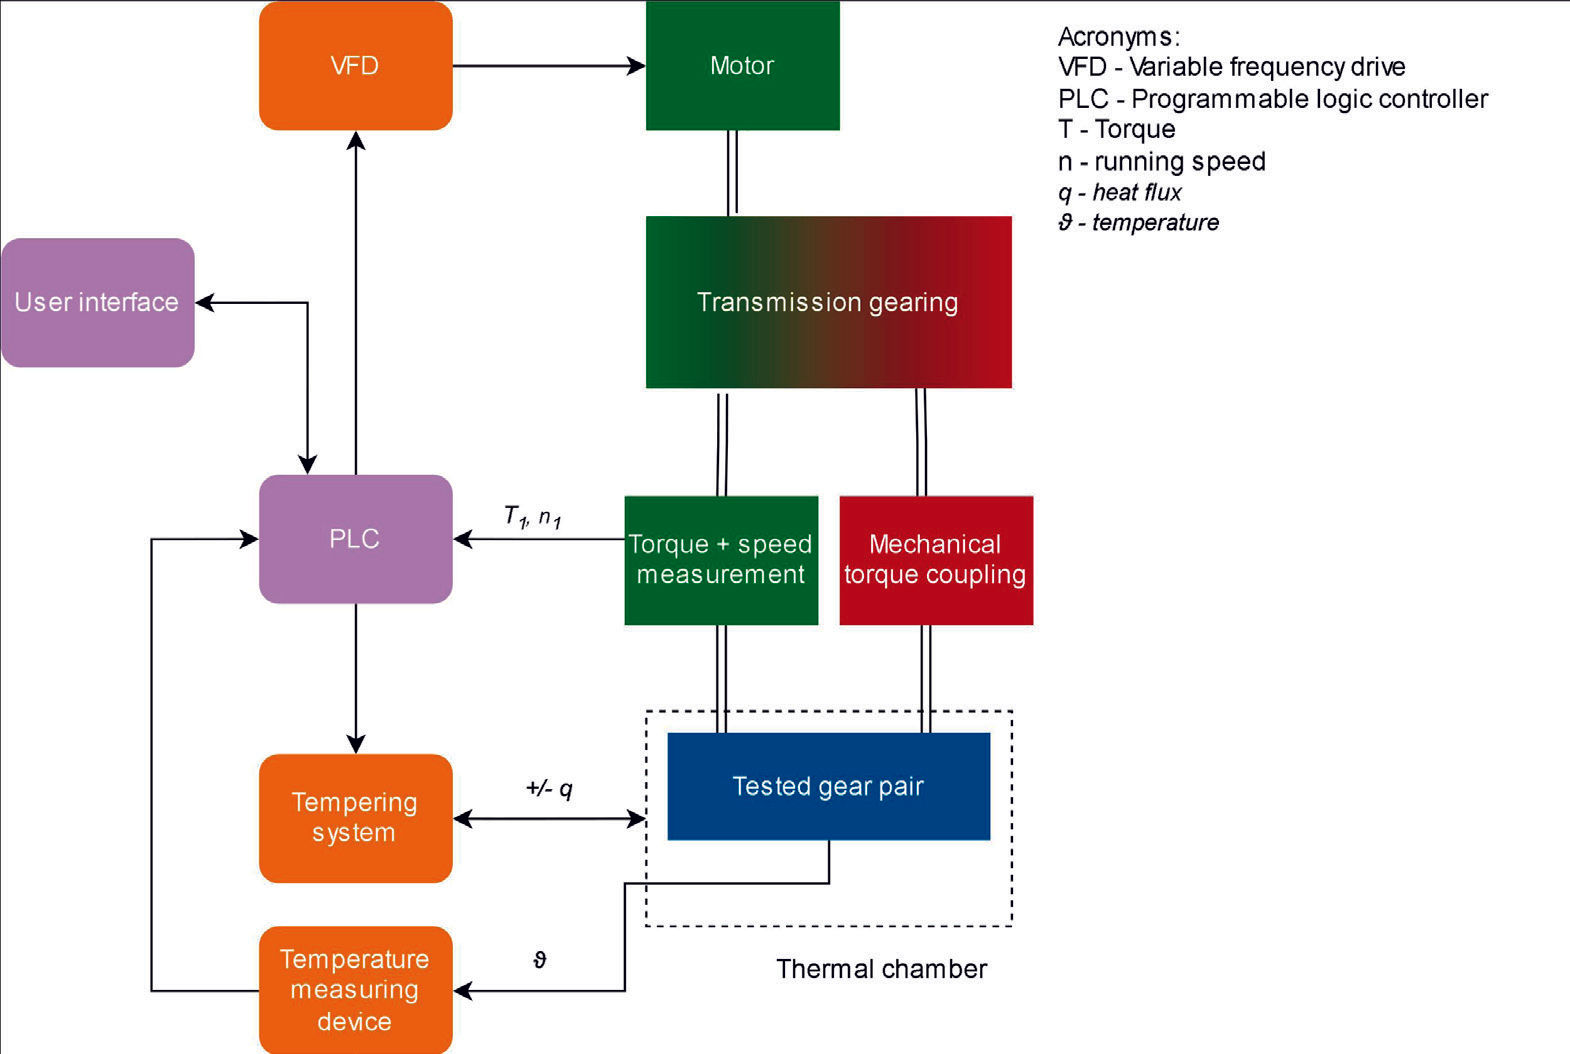
Another possible test bench layout is a mechanically open loop system (Figure 10), where on one side, the motion and power are applied by a motor and on the braking shaft, the braking torque is usually applied by employing a brake or a generator. Such a test rig concept allows for a continuously adjustable center distance, enabling the testing of several different gear geometries. By controlling the torque and speed on both sides, the load applied on the tested gear pair can be controlled very accurately.
Figure 10—Schematic representation of an open-loop test rig.
Additionally, the open-loop type test rig can be formed of a pair of electric motors where one provides the input driving torque to the pinion while the other acts as a brake on the driven side. The drive and brake shafts can be positioned in parallel, one next to the other in which case the motors must be connected to both shafts via belts or chain transmissions. A schematic representation of this configuration is shown in Figure 11.
Figure 11—Schematic representation of an open-loop test rig with parallel driving/ braking motor configuration.
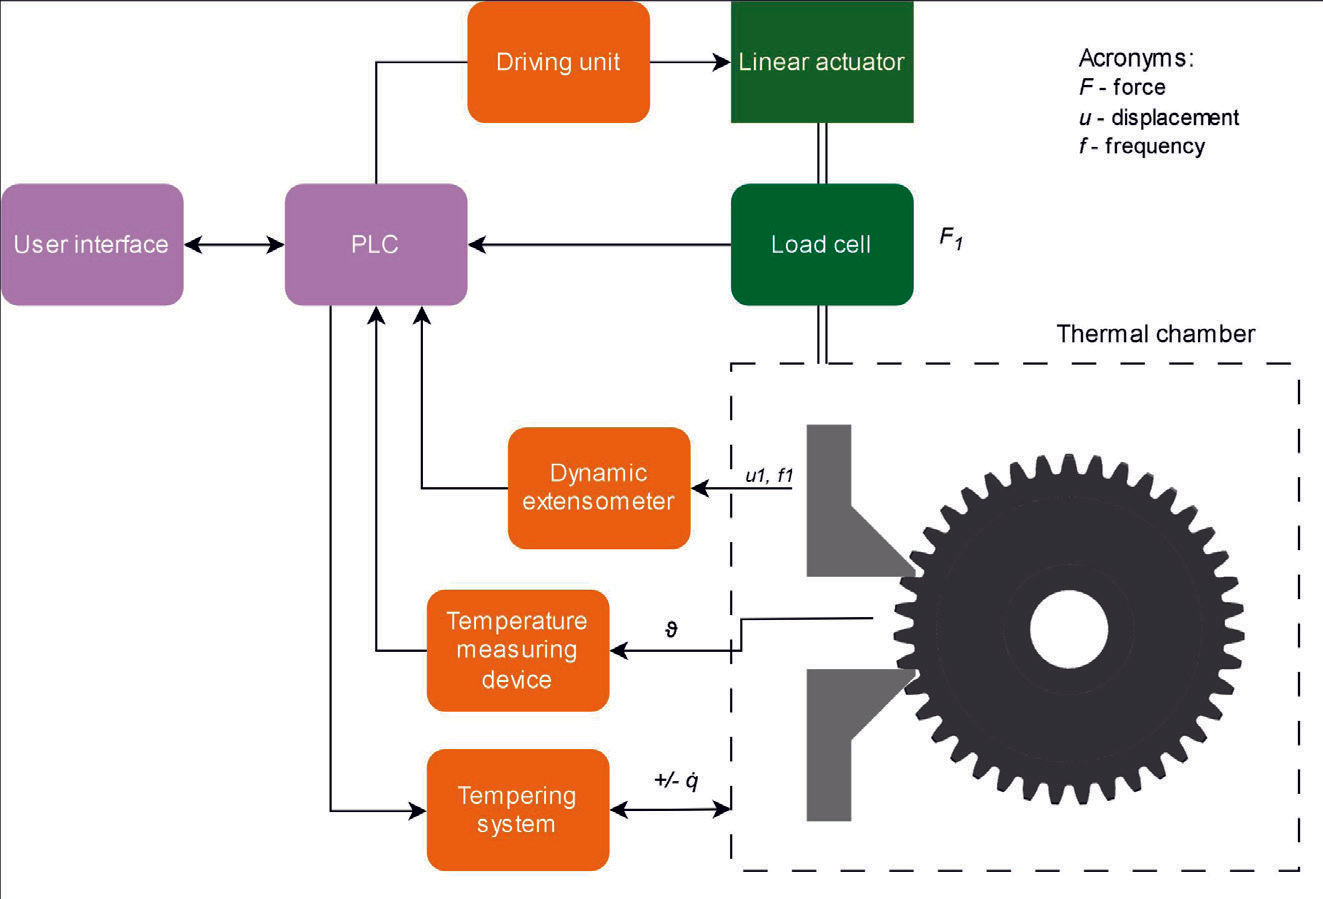
The fourth possible layout is the pulsator test rig, also called a single-tooth bending test machine (Figure 12). In this type of test rig, a single tooth is subjected to pulsating cyclic loading in the tangential direction relative to the gear tooth. The limitation of the test rig is that it can only be employed to study root fatigue, while other possible failure modes, e.g., wear, pitting or thermal overload, cannot be observed. Another limitation is that the load on the tooth is not applied in the same direction as when gears are meshing, requiring a suitable analytical model to correlate the results with gear-meshing conditions.
Figure 12—Schematic representation of a pulsator test rig.
Irrespective of the test rig design, the most important testing conditions, i.e., the transferred torque, the plastic gear’s temperature and the rotational speed, need to be precisely controlled during the entire test. While torque and speed control can be quite easily achieved, controlling the plastic gear’s temperature is a bit more challenging. Tests conducted for S-N curve generation are usually performed at a selected rotational speed and various torque levels. The rate of heat generation and the resulting temperature rise depend strongly on the transmitted torque. A sophisticated gear-temperature control system is therefore required to control the plastic gear’s temperature at a selected level, irrespective of the tested torque and rotational speed.
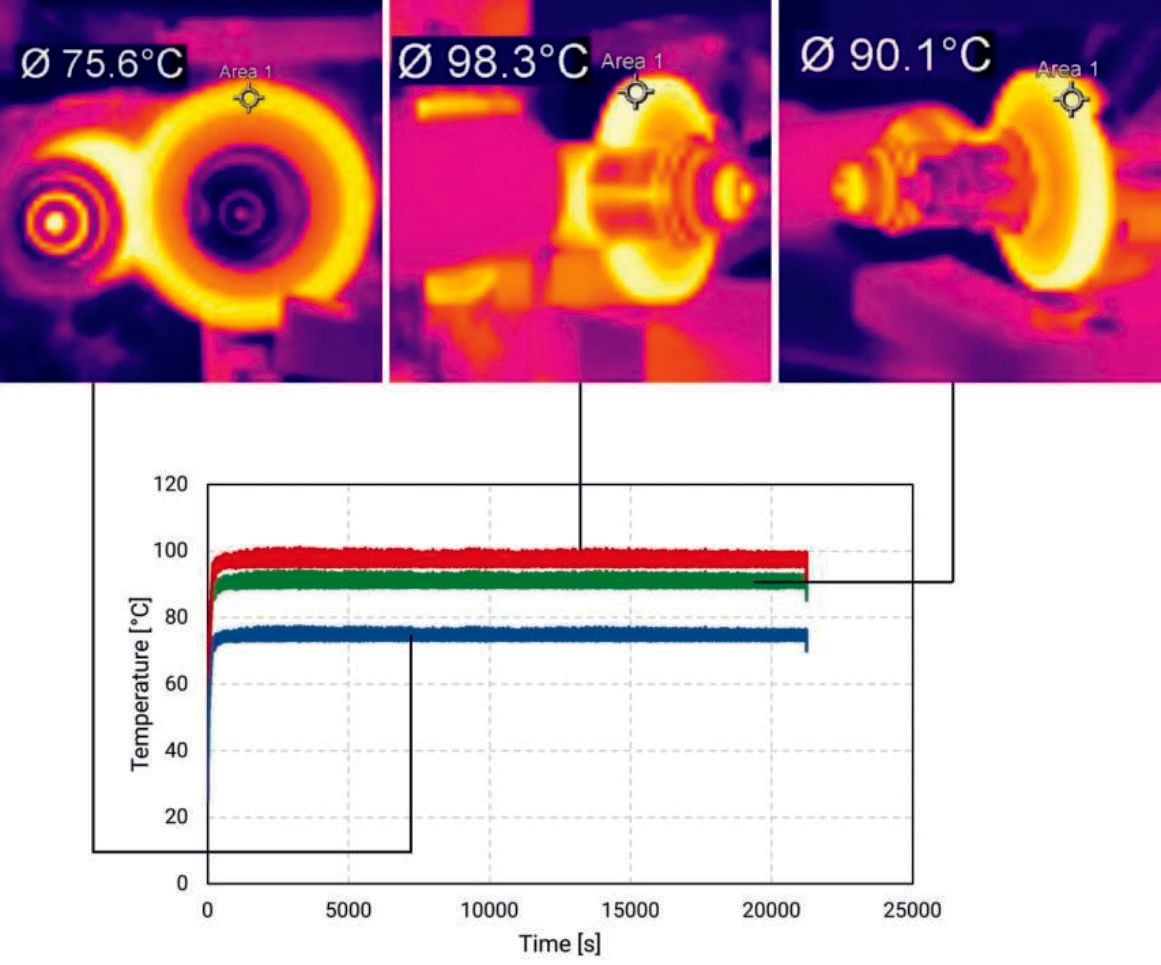
The increase in gear temperature significantly impacts the durability and fatigue resistance of polymer gear pairs. S-N curves, which chart stress against the number of cycles to failure, must be assessed as a function of temperature. Typically, these curves are characterized as a function of bulk root temperature. However, as seen in Figure 13, the choice of a measurement point greatly affects the results. The images depict a gear test conducted under controlled conditions (with a temperature set at 90°C), selecting three different points for measurement. These varying points can yield substantially different outcomes.
VDI 2736 offers general instructions for measuring root temperatures, yet a more precise specification is advisable. It is recommended to place the measurement sensor at the midpoint of the gear’s face width and on the passive flank side. This location typically provides an average temperature that accurately reflects the root temperature, given that the passive tooth flank does not heat up substantially compared to the root temperature, and it will therefore influence the measurement only marginally. Conversely, placing the sensor on the side surface beneath the root tends to produce significantly lower temperature readings compared to those at the center of the face width.
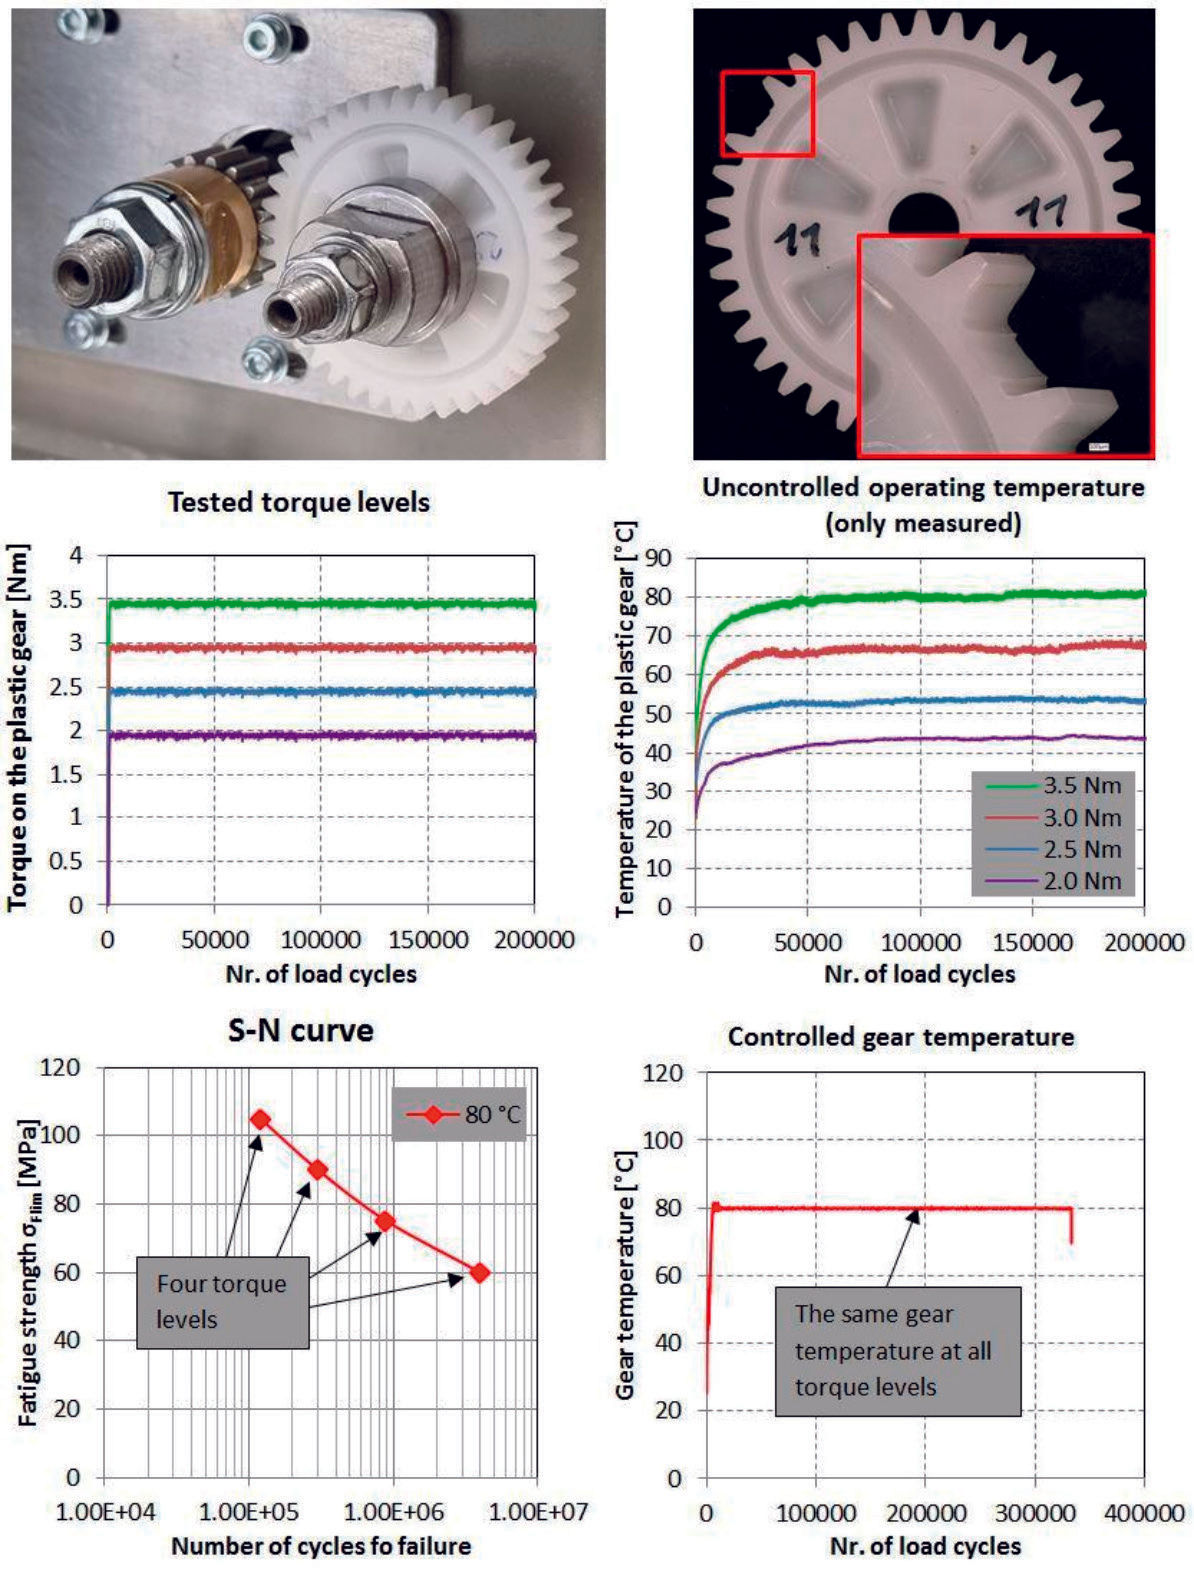
Figure 13—Tested loads and the controlled operating temperature ofthe plastic gear.
S-N Curve Testing
To avoid root fatigue failure, the root stress in a gear needs to be lower than the material’s fatigue strength limit for the required operating lifespan. To account for unexpected effects some additional safety is usually also included. The information on the material’s fatigue strength can be summarized in an S-N curve. To generate an S-N curve, several test repetitions need to be conducted at various loads, and all the samples need to be tested until a fatigue-induced failure occurs, as shown in Figure 14. For gears, the S N curves can be generated by extensive testing in a gear-on-gear application or by a single tooth bending test on a pulsator test stand. Both methods have their pros and cons.
In a gear-on-gear test methodology usually a combination of a steel pinion and a plastic gear is employed as presented in Figure 14. The steel/plastic combination is most appropriate for the S-N curve testing since the curve is a property of a single material. Therefore, failure should occur on the gear of which the material is being evaluated. In the case of a plastic/plastic combination, failure would be close to impossible to control, and a situation could occur where it would not be possible to induce a failure on a gear made of material under evaluation. Another problem with a plastic/plastic gear combination would be a significantly increased tooth contact, and the actual stress in the material would further deviate from the calculated one. The one calculated by the analytical equation (VDI 2736 or DIN 3990 or ISO 6336), FEA provides an accurate stress calculation if the numerical model is set up accordingly.
While operating, the gears heat up. Friction between the meshing teeth and hysteretic effects are the main reasons for the temperature increase in plastic gears. The rate of heat generation and the resulting temperature rise depend on several factors, e.g., torque, rotational speed, coefficient of friction, lubrication, thermal conductivity, convection, gear geometry, etc. The mechanical properties (strength, hardness, elastic modulus) of polymers and polymer composites are strongly temperature dependent. Therefore, several S-N curves, generated for different temperatures of the tested sample, are required for the design of plastic gears. Precise temperature control of tested gear samples is therefore crucial for the characterization of S-N curves for plastic gears. Advanced stopping algorithms need to be applied as well since the test needs to be stopped instantly once the first tooth is fractured (Figure 14).
Figure 14—S-N curve generation.
A combination of a steel pinion and a plastic gear is usually employed for the S-N curve generation. As the purpose of testing is to generate fatigue data on the selected plastic material, the failure needs to occur on the plastic gear. The test needs to be stopped when the first tooth is fractured. In a plastic/plastic configuration, the failure would be impossible to control, and usually, both gears get damaged at the end of the test. Furthermore, the load-induced contact ratio increase would be even higher for a plastic/plastic gear configuration. Tested gears need to be tested at a minimum of four different load levels, where the torque is accurately controlled during testing. The operating temperature of the plastic gear needs to be controlled at a selected level at all tested torques. At least three test repetitions need to be conducted at each tested torque level to ensure repeatability. All tests need to be conducted until there is a fatigue-induced failure.
Wear Characterization
The wear behavior of plastic gears can be best studied by conducting gear tests. Simple tribological tests, e.g., disk-on-disk, can provide basic information about materials’ behavior in a rolling-sliding motion under nonconformal contact, but for an in-depth understanding of the wear behavior in the gear contact, gear testing needs to be conducted.
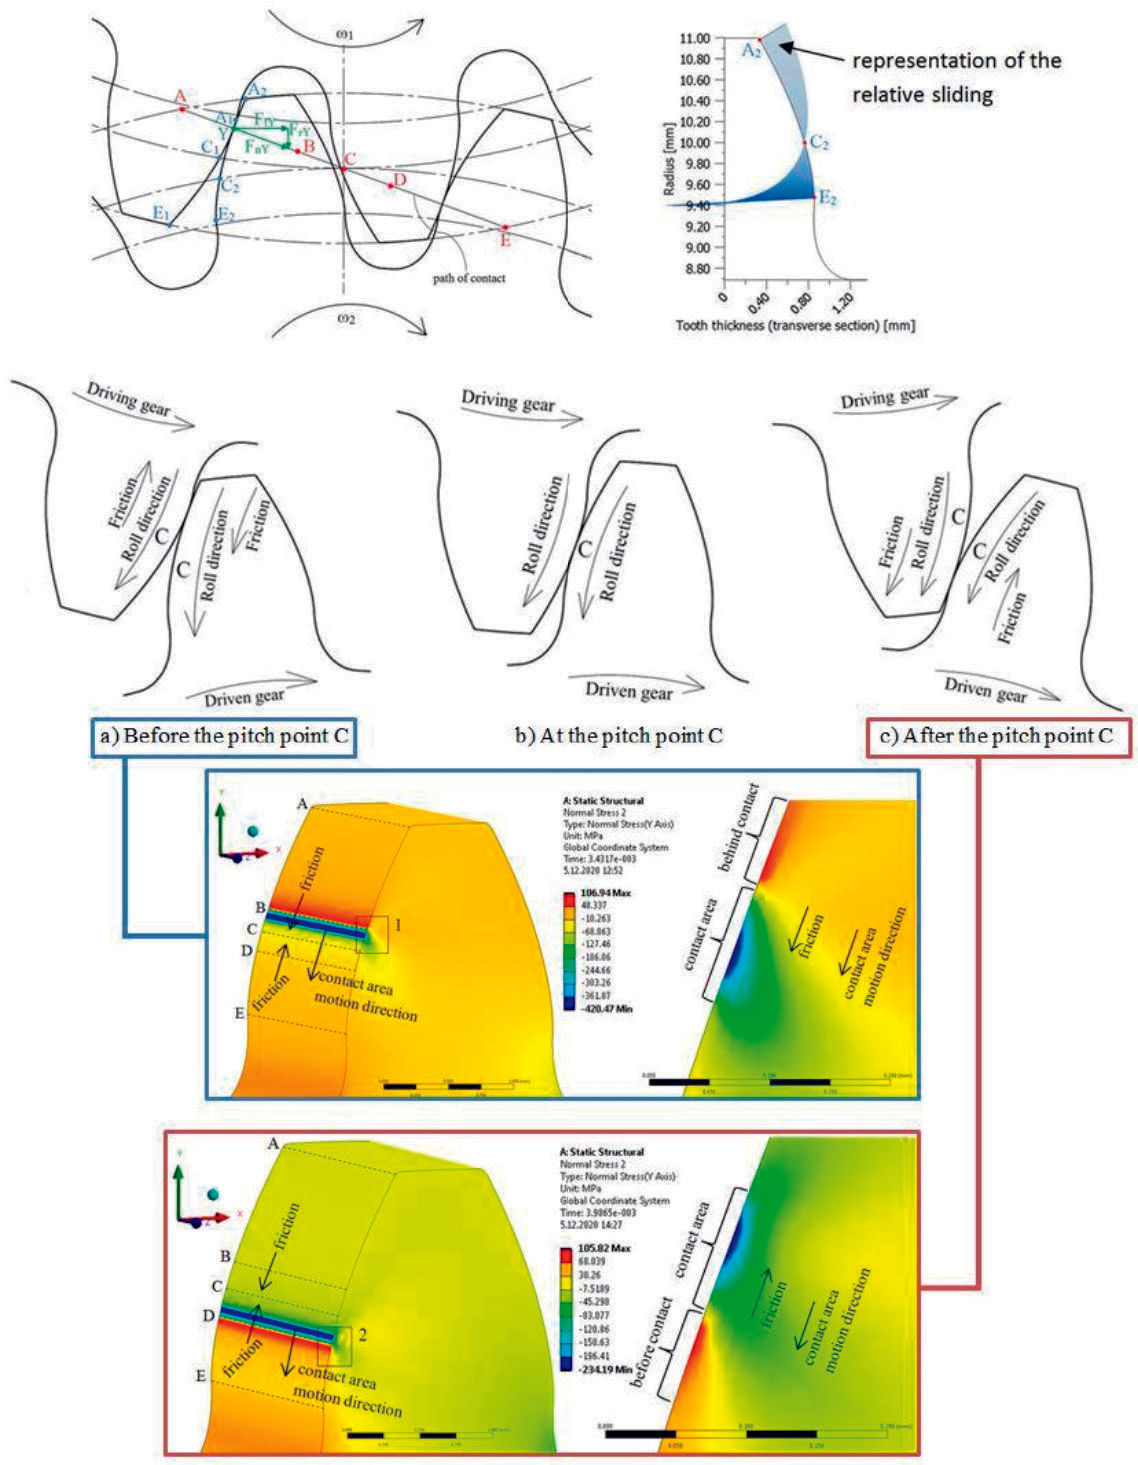
The contact conditions between the two meshing flanks are shown in Figure 15; rolling and sliding motions are present between the surfaces in contact. The direction of sliding and the frictional force are reversed when passing through the pitch point C. On the driven gear, the direction of sliding points always towards the pitch point C, so the kinematic line is usually clearly visible on the worn gear surface. The main difference, when compared to the disk-on-disk test, is that with the disk-on-disk test, the sliding rate is constant all the time, and the direction of the frictional force remains the same. The pin-on-disk test is even less suitable since there is only sliding motion present in contact without any rolling.
Figure 15—Contact conditions during gear meshing. The directionof friction changes once the contact passes the pitch point. Thefrictional force is on the driven gear and always oriented towards thepitch point and vice-versa on the drive gear.
The gear-meshing process is presented in Figure 15. The theoretical path of contact of the involute gears pair has the shape of a straight line. During operation, gears transfer torque, which results in a normal force FnY acting in an arbitrary meshing point Y between the two teeth in contact (Figure 15). The normal force FnY can be decomposed to radial FrY and tangential force FtY. In involute gear pairs, the normal force acts along the path of contact. The gears start to mesh in point A, this is point A1 on the flank of the drive gear and point A2 on the flank of the driven gear. In the meshing area A-B, two pairs of teeth are in contact; therefore, the transmitted load is divided between them. Point B is the highest point of single tooth contact for the driven gear. In the B-D area, the total load is transmitted only through one pair of teeth. Point D is the lowest point of single tooth contact for the driven gear. At this point, the next pair of teeth comes into contact and the load is in the area D-E again transmitted via two pairs of teeth. Hence, the load on a single tooth is not constant during meshing along the path of contact. Meshing ends in point E, this is point E1 on the flank of the drive gear and point E2on the flank of the driven gear. When gears are meshing from A to C, the flank part A1C1on the drive gear is meshing with the flank part A2C2 on the driven gear. Due to the different lengths of the flank parts in contact, specific sliding occurs between the surfaces in contact (Figure 15). Analogously, the same happens in the meshing part from C to E, except that when passing through the kinematic point C, the direction of sliding is reversed. Most sliding occurs in the root part of the tooth, where the greatest wear is to be expected. In theory, there is no sliding at pitch point C, only pure rolling due to tooth deflection; sliding also occurs at point C. Such specific contact conditions can be best represented by a gear-on-gear test.
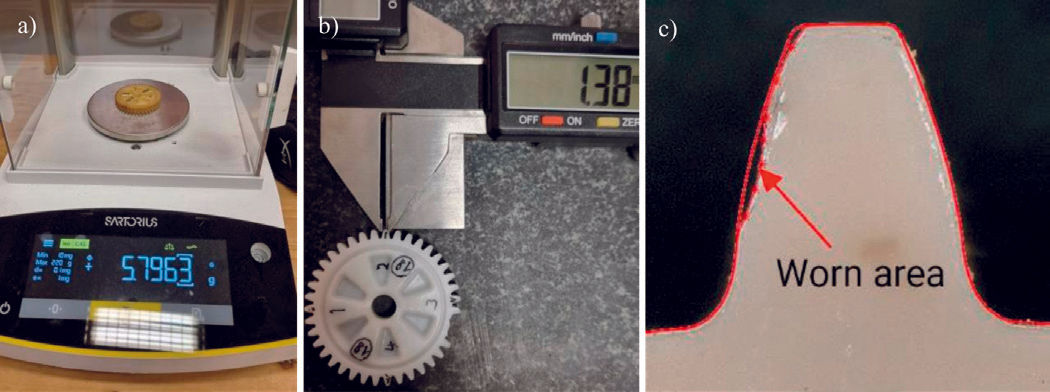
Different wear characterization methods can be used, as presented in Figure 16. The most used ones are the gravimetric method and the tooth thickness reduction method. When employing the gravimetric method wear is characterized as the loss of mass, while in the tooth thickness reduction method, the wear is determined as the reduced tooth’s chordal thickness. Several advanced methods can also be used, e.g., image processing or optical measurements; however, these are more costly and labor intensive. The wear can be tracked during testing by conducting regular checkpoints or the wear is measured after a specified number of load cycles. Different stages of wear a presented in Figure 17.
Figure 16—Wear measuring techniques: a) gravimetric method, b)tooth thickness reduction method, c) image processing method.Figure 17—Wear in different stages: a) Initial wear, b) Significant wear,in practice usually still acceptable, c) Critical wear which led to failure.
COF Characterization
There are currently no methods that enable measuring the coefficient of friction (COF) directly during gear operation. However, some methods enable measurement of COF in conditions much closer to a gear contact. The coefficient of friction can be assessed well using the disk-on-disk test configuration, as shown in Figure 18. In such a test configuration, two disks made of selected materials are pressed together with a controlled force and rotate, each with a respective rotational speed, to generate a rolling and relatively sliding contact between them. All possible material combinations can be tested in such a test configuration; however, when testing plastics, the plastic sample’s temperature must be rigorously controlled as the coefficient of friction is also temperature-dependent. Another possibility to get a very good assessment on the COF is by employing an implicit characterization method as proposed by Černe et al. (Ref. 32).
Figure 18—Disk-on-disk test configuration.
Conclusions
Plastic gears offer several advantages over metal gears. With an increase of e-mobility and the growing demands on the user experience where the NVH needs to be held at a minimum, plastic gears show great potential. They also provide great benefits in terms of cost optimization and energy savings.
For the reliable design of plastic gears, several different failure modes need to be considered. The VDI 2736 guideline provides methods and models to control individual failure modes in the gear design phase. A major problem preventing the use of these methods is the lack of gear-specific material data, which is required to conduct the required design and control calculations.
Outlook
The lack of reliable gear-specific material data is still a major problem for the design of plastic gears. The data currently available in the guidelines and commercial software packages was in large part generated in a non-consistent way without a traceable and repetitive process. For the generation of reliable material data, a standard is required which would define the test geometries, sample-production process, sample quality requirements, testing methods and post-processing of the test data. With the emergence of an international standard and high-quality material data generated according to the procedures defined by the standard, the actual growth potential of plastic gears would be reached.
References
D. Zorko, J. Duhovnik, and J. Tavčar, “Tooth bending strength of gears with a progressive curved path of contact,” J. Comput. Des. Eng., Vol. 8, No. 4, pp. 1037–1058, Aug. 2021, doi: 10.1093/jcde/qwab031.
T. J. Hoskins, K. D. Dearn, S. N. Kukureka, and D. Walton, “Acoustic noise from polymer gears–A tribological investigation,” Mater. Des., Vol. 32, No. 6, pp. 3509–3515, Jun. 2011, doi: 10.1016/j.matdes.2011.02.041.
B. Trobentar, M. Hriberšek, S. Kulovec, S. Glodež, and A. Belšak, “Noise Evaluation of S-Polymer Gears,” Polymers, Vol. 14, No. 3, p. 438, Jan. 2022, doi: 10.3390/polym14030438.
B. Polanec, S. Glodež, and A. Belšak, “Noise Evaluation of Coated Polymer Gears,” Polymers, Vol. 15, No. 3, p. 783, Feb. 2023, doi: 10.3390/polym15030783.
“BS 6168:1987 Specification for non-metallic spur gears.” British Standards Institution, 1987.
“JIS B 1759: Estimation of tooth bending strength of cylindrical plastic gears. Japanese National Standard.” 2013.
“ISO 6336: Calculation of load capacity of spur and helical gears, Parts 1-6, International standard.” 2006.
Moriwaki, A. Ueda, M. Nakamura, K. Yoneda, and D. Iba, “New Japanese Standard JIS B 1759 on load capacity of plastic gears,” in International Gear Conference 2014: 26th–28th August 2014, Lyon, Elsevier, 2014, pp. 1172–1178. doi: 10.1533/9781782421955.1172.
“VDI 2545: Zahnräder aus thermoplastischen Kunststoffen.” 1981.
“ANSI/AGMA 1106-A97: Tooth Proportions for Plastic Gears.” American Gear Manufacturers Association, 1500 King Street, Suite 201, Alexandria, Virginia 22314, 1997.
“AGMA 920-A01: Materials for Plastic Gears.” American Gear Manufacturers Association, 1500 King Street, Suite 201, Alexandria, Virginia 22314, 2001.
J. Tavčar, B. Černe, J. Duhovnik, and D. Zorko, “A multicriteria function for polymer gear design optimization,” J. Comput. Des. Eng., No. qwaa097, Jan. 2021, doi: 10.1093/jcde/qwaa097.
U. Urbas, D. Zorko, and N. Vukašinović, “Machine learning based nominal root stress calculation model for gears with a progressive curved path of contact,” Mech. Mach. Theory, Vol. 165, p. 104430, Nov. 2021, doi: 10.1016/j.mechmachtheory.2021.104430.
C. Jia, P. Wei, Z. Lu, M. Ye, R. Zhu, and H. Liu, “A novel prediction approach of polymer gear contact fatigue based on a WGAN‐XGBoost model,” Fatigue Fract. Eng. Mater. Struct., Vol. 46, No. 6, pp. 2272–2283, Jun. 2023, doi: 10.1111/ffe.13997.
B. Trobentar, S. Kulovec, G. Hlebanja, and S. Glodež, “Experimental failure analysis of S-polymer gears,” Eng. Fail. Anal., Vol. 111, p. 104496, Apr. 2020, doi: 10.1016/j.engfailanal.2020.104496.
R. Wu, P. Wei, Z. Lu, H. Liu, D. Zorko, and H. Xie, “A comparative study of fatigue behavior between S-shaped and involute POM gears,” J. Comput. Des. Eng., Vol. 9, No. 6, pp. 2483–2494, Dec. 2022, doi: 10.1093/jcde/qwac121.
D. Zorko, J. Tavčar, R. Šturm, and Z. Bergant, “Investigation of the durability and performance of autoclave-cured, woven carbon fiber-reinforced polymer composite gears in mesh with a steel pinion,” Compos. Struct., Vol. 273, p. 114250, Oct. 2021, doi: 10.1016/j.compstruct.2021.114250.
D. Zorko, J. Tavčar, M. Bizjak, R. Šturm, and Z. Bergant, “High cycle fatigue behaviour of autoclave-cured woven carbon fibre-reinforced polymer composite gears,” Polym. Test., Vol. 102, p. 107339, Oct. 2021, doi: 10.1016/j.polymertesting.2021.107339.
B. Černe, Z. Bergant, R. Šturm, J. Tavčar, and D. Zorko, “Experimental and numerical analysis of laminated carbon fibre-reinforced polymer gears with implicit model for coefficient-of-friction evaluation,” J. Comput. Des. Eng., Vol. 9, No. 1, pp. 246–262, Feb. 2022, doi: 10.1093/jcde/qwab083.
U. Urbas, D. Zorko, N. Vukašinović, and B. Černe, “Comprehensive Areal Geometric Quality Characterisation of Injection Moulded Thermoplastic Gears,” Polymers, Vol. 14, No. 4, 2022, doi: 10.3390/polym14040705.
“VDI 2736: Blatt 4, Thermoplastische Zahnräder, Ermittlung von Tragfähigkeitskennwerten an Zahnrädern.” VDI-Verlag GmbH, Duesseldorf, 2014.
H. Hachmann and E. Strickle, “Polyamide als Zahnradwerkstoffe (Polyamides as materials for gear wheels),” Konstruktion, Vol. 18, No. 3, pp. 81–94, 1966.
Erhard, G. and Weis, C., “Zur Berechnung der Zahn- und Flankentemperatur von Zahnrädern aus Polymerwerkstoffen (On the calculation of tooth and tooth flank temperatures in gear wheels made of polymeric materials),” Konstruktion, Vol. 39, pp. 423–430, 1987.
C. M. C. G. Fernandes, D. M. P. Rocha, R. C. Martins, L. Magalhães, and J. H. O. Seabra, “Finite element method model to predict bulk and flash temperatures on polymer gears,” Tribol. Int., Vol. 120, pp. 255–268, Apr. 2018, doi: 10.1016/j.triboint.2017.12.027.
V. Roda-Casanova and F. Sanchez-Marin, “A 2D finite element based approach to predict the temperature field in polymer spur gear transmissions,” Mech. Mach. Theory, Vol. 133, pp. 195–210, Mar. 2019, doi: 10.1016/j.mechmachtheory.2018.11.019.
B. Černe, M. Petkovšek, J. Duhovnik, and J. Tavčar, “Thermo-mechanical modeling of polymer spur gears with experimental validation using high-speed infrared thermography,” Mech. Mach. Theory, Vol. 146, p. 103734, Apr. 2020, doi: 10.1016/j.mechmachtheory.2019.103734.
“DIN 3990: Calculation of load capacity of cylindrical gears, German national standard.” 1987.
D. Zorko, “Effect of Process Parameters on the Crystallinity and Geometric Quality of Injection Molded Polymer Gears and the Resulting Stress State during Gear Operation,” Polymers, Vol. 15, No. 20, p. 4118, Oct. 2023, doi: 10.3390/polym15204118.
“ISO 1328-1:2013: Cylindrical gears - ISO system of flank tolerance classification - Part 1: Definitions and allowable values of deviations relevant to flanks of gear teeth.” 2013.
“ISO 1328-2:1997: Cylindrical gears - ISO system of accuracy - Part 2: Definitions and allowable values of deviations relevant to radial composite deviations and runout information.” 1997.
B. Černe, Z. Bergant, R. Šturm, J. Tavčar, and D. Zorko, “Experimental and numerical analysis of laminated carbon fibre-reinforced polymer gears with implicit model for coefficient-of-friction evaluation,” J. Comput. Des. Eng., Vol. 9, No. 1, pp. 246–262, Feb. 2022, doi: 10.1093/jcde/qwab083.
First presented at the 2024 Fall Technical Meeting (FTM), October 7–9, 2024, Rosemont, IL. Printed with permission of the author(s). Statements presented in this paper are those of the author(s) and may not represent the position or opinion of the American Gear Manufacturers Association.