Experimental Study on the Performance of Plastic Worm Gears
Plastic worm and crossed helical gears are increasingly utilized in various applications due to their distinct advantages over traditional metal worm gear drives. These advantages include lower weight, reduced noise, and corrosion resistance, making them ideal for automotive, consumer electronics, and medical devices. However, plastic gears also come with limitations such as lower load-bearing capacity and higher susceptibility to temperature variations and wear. The design and calculation of plastic crossed-helical gears (often referred to simply as worm gears) are defined in guidelines like VDI 2736, which provides comprehensive methods for material selection, dimensioning, and performance prediction. Experimental testing, also thoroughly described in VDI 2736, includes procedures to evaluate the durability and efficiency of these drives under realistic operating conditions.
In most applications, plastic worm gear pairs are composed of a metal worm paired with a polymer worm wheel. In terms of load-carrying capacity, several types of failure modes typically determine the service life of a plastic worm gear pair. Out of these, fatigue is one of the most detrimental and often exhibited failure modes in worm gear drives. Polymer worm wheel fatigue was studied by Nomura et al. (Ref. 1), who tested polymer worm wheels in pairs with various metal worm geometries. Kim et al. (Ref. 2) additionally tested the durability of a glass fiber-reinforced polyamide polymer worm wheel used in a car steering system. They identified root fatigue with cracks forming slightly above the root to be the driving failure mode.
Marshek et al. (Ref. 3) noted that polymer worm gear drives can fail due to multiple failure modes simultaneously, e.g., fatigue combined with wear. Wear was studied in more detail using SEM microscopy by the same author (Ref. 4), who noted that pitting and ridge formation are two types of flank damage phenomena often related to wear on polymer worm wheels. In the already noted study by Kim et al. (Ref. 2), wear, as a function of running cycles, was also studied. Wear was measured as a function of angle loss during meshing.
Additionally, the NVH (noise vibration and harshness) behavior of polymer gears is often of interest, since one of the key goals of polymer gear drives is to reduce the noise level in a gear transmission. Chakroun et al (Ref. 5) presented a numerical model, based on the Generalized Maxwell Model (GMM), a widely adopted type of viscoelastic constitutive mechanical model, to analyze the influence of the non-elastic mechanical characteristics of the polymer wheel on the frequency-spectrum vibration response of the meshing gear drive.
Despite these advancements, achieving higher performance in plastic worm gear drives remains challenging. Current research is focused on enhancing material properties, improving manufacturing precision, and developing more robust predictive models to bridge the performance gap compared to their metal counterparts. The study presented focuses on the implementation of the state-of-the-art worm gear calculation methods, exemplified by the VDI 2736 guideline and the experimental testing aspects correlated with this implementation. Via an executed case study, the work outlines suitable testing methodologies for the characterization of worm wheel limiting strength parameters. These parameters are essential for the implementation of the calculation methods defined in the guideline. Additionally, practical aspects related to the implemented testing procedures are discussed.
Worm Geometry Variants
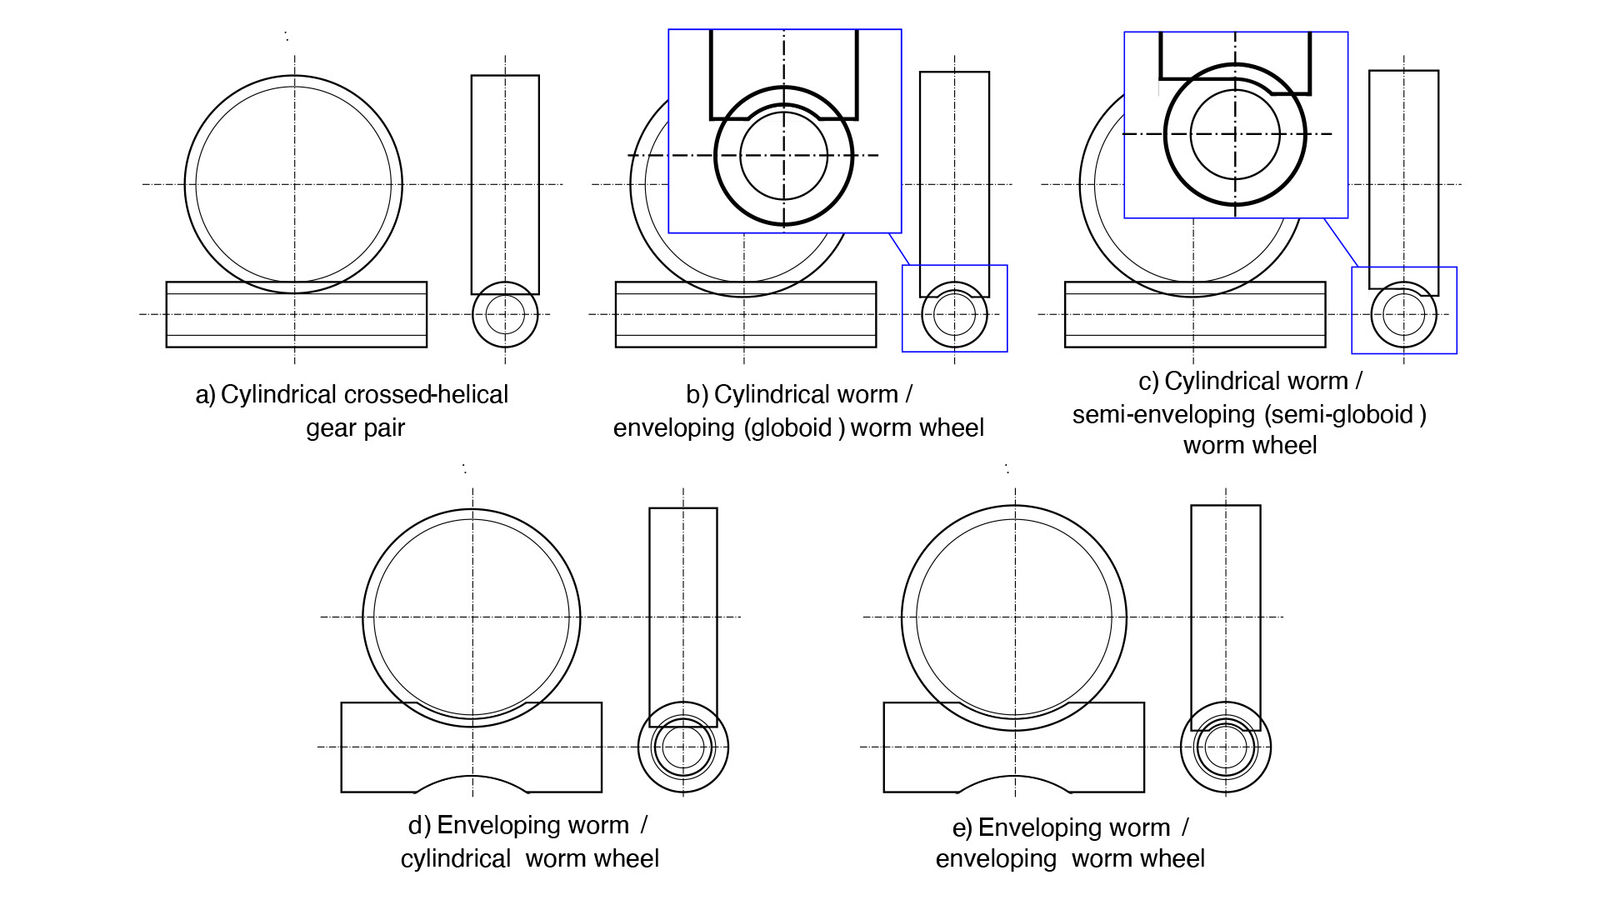
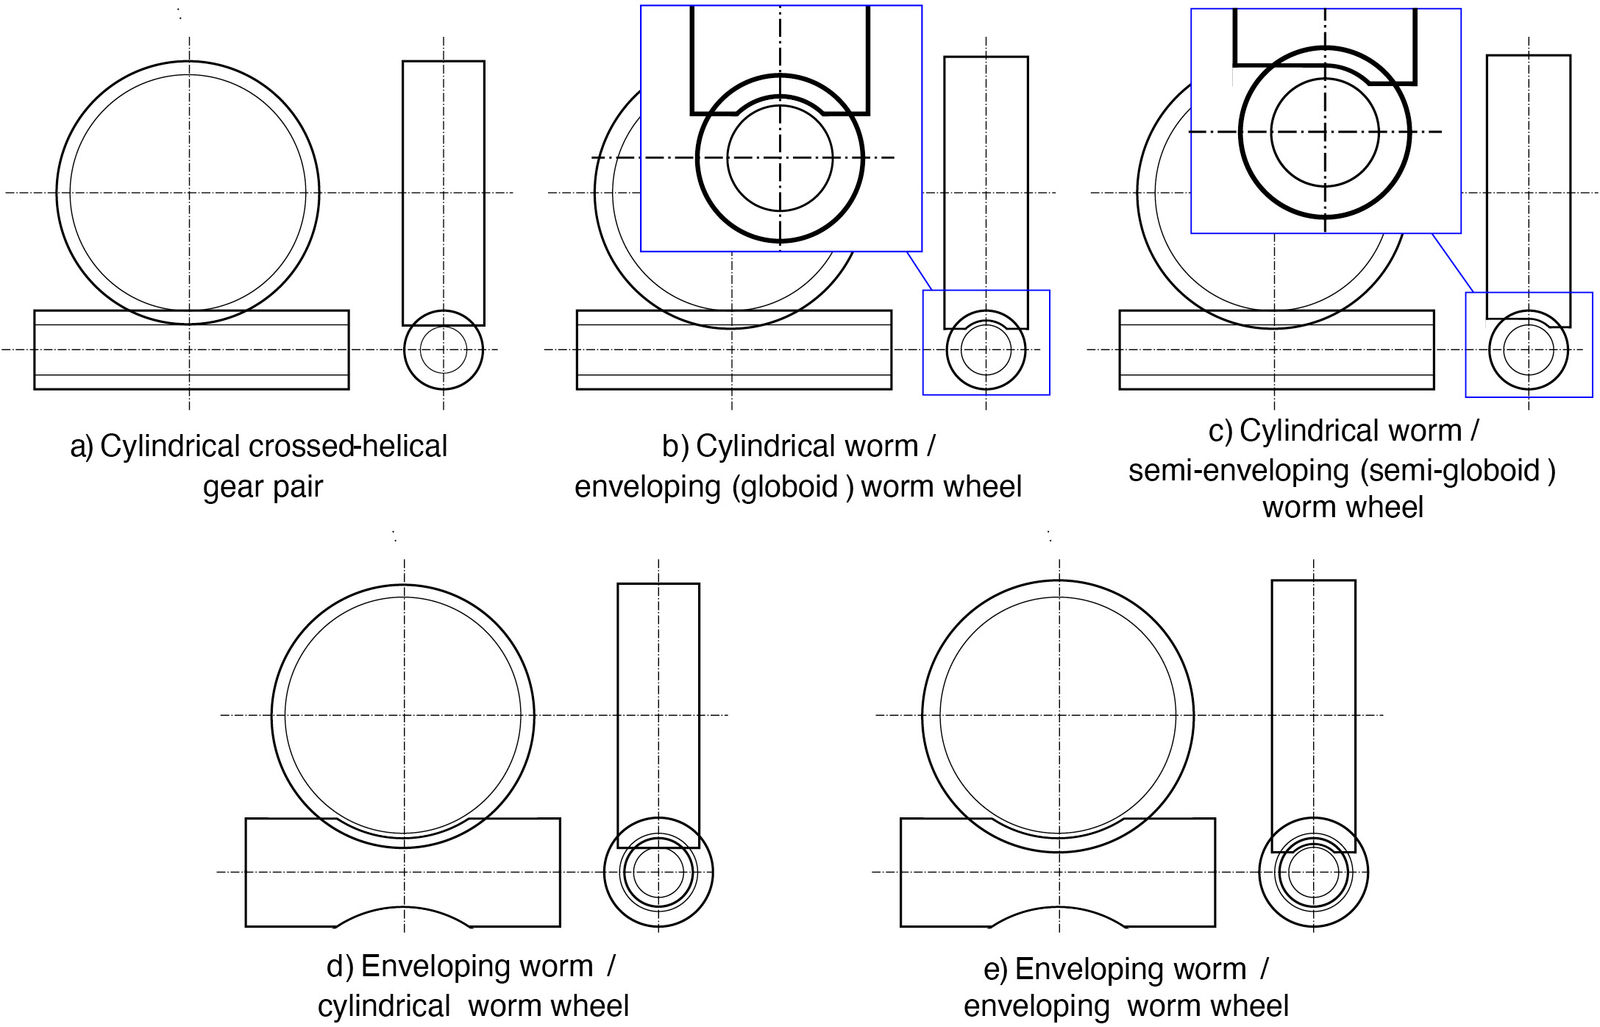
Several variations of worm gear drives exist, each offering distinct advantages and disadvantages. The possible combinations are schematically shown in Figure 1 and include:
Cylindrical crossed-helical gear pair
Cylindrical worm paired with enveloping (globoid) worm wheel
Cylindrical worm paired with semi-enveloping (semi-globoid) worm wheel
Enveloping worm paired with cylindrical worm wheel
Enveloping worm paired with enveloping worm wheel
Figure 1—Available crossed helical and worm gear geometry configurations.
The most common type is the cylindrical crossed-helical gear pair, where both the “worm” and the “worm wheel” are cylindrical and hold a helical lead profile. This simple design is relatively straightforward to manufacture, also using plastic processing methods like injection molding. The main drawback of this gearing geometry is that it results in a theoretical point contact during meshing and consequently offers a lower load-carrying capacity due to a less favorable load distribution across a small contact area on the active flank.
For improved load-carrying capacity, durability and smoother operation, enveloping worm gears can be produced. This design offers an improved line-contact load distribution, potentially leading to reduced wear and a longer service life. Two main variations exist: cylindrical worm/enveloping (globoid) worm wheel and enveloping worm / cylindrical worm wheel. In the former, the worm wheel has a curved profile, matching the worm’s curvature of the helix, which prolongs the path of contact. The latter features a curved, hourglass-shaped worm gear meshing with a straight-toothed worm wheel. Both offer improvements over the basic cylindrical pair, but the cylindrical worm / globoid worm wheel generally boasts the highest efficiency due to its deeper tooth engagement. On the other hand, both geometries increase the complexity and cost of production. A globoid worm wheel is especially problematic for plastic injection molding since it exhibits negative draft angles, which hampers the possibility for part ejection from the molding tool. To amend this problem, a semi-enveloping (semi-globoid) worm wheel geometry can be introduced that provides partial line contact and avoids negative draft angles that undermine part ejection in the globoid geometry.
Finally, the least common variant is the enveloping worm / enveloping worm wheel. Both the worm and the worm wheel have curved profiles, maximized tooth contact and achieved the best load distribution among all these designs. However, these benefits come at the cost of increased manufacturing difficulty, as already discussed above. Our further analysis will entirely be based on cylindrical crossed-helical gear pairs, since this geometry is by far the most commonly used in plastic worm gear drives and the VDI 2736: Part 3 guideline also provides calculation methods for this type of gear pair. To simplify communication, in subsequent sections, the words “worm” and “worm wheel” will be used to denote the pinion and gear of the analyzed crossed-helical gear pair.
Failure Modes and Load Carrying Capacity Evaluation of Plastic Worm Gear Drives
Plastic worm gear drives are commonly designed by employing a metal worm in pair with a plastic worm wheel. Plastic worms, although viable, are used less often due to the complexities involved in injection molding and much lower achievable load carrying capacity and service life compared to metal variants. In this regard, available design guidelines and standards, like the VDI 2736: Part 3 (Ref. 6), further discussed in the following sections, also focus primarily on the evaluation of plastic worm wheels. The design of this type of worm wheels involves a durability control against the most commonly experienced failure modes during gear running (Fig. 2). In general, there are various failure modes that can, depending on the materials, loads, and lubrication conditions, occur on plastic worm wheels (Ref. 7), including:
Thermal failure
Root fatigue failure
Flank fatigue failure
Pitting
Wear
Viscoplastic tooth deformation
[advertisement]
Figure 2—Examples of various failure and damage modes exhibited on polymer worm wheels- a) thermal overload, b) wear, c) tooth deformation, d) tooth fatigue fracture and e) root fatigue fracture.
These are, in essence, the same types of failure modes exhibited by cylindrical (parallel axis) plastic gears. However, there are certain differences in the way these failure modes manifest and their probability of occurrence. In the following sections, the main failure modes will be presented in more detail, with methods of durability evaluation and experimental characterization further discussed.
Standards and Guidelines for Load-Carrying Capacity Evaluation
In the past few decades, there has been a gradual evolution in worm and crossed-helical gear design standards. The already noted VDI 2736: Part 3 guideline for plastic non-enveloping worm gears has its foundation in the DIN 3996 standard, which covers the calculation of load-carrying capacity of metal worm gears. The standard covers calculation methods for pitting resistance, wear load capacity, worm shaft deflections, tooth root strength, and thermal stability (Ref. 8). The standard has undergone revisions, with the 2012 and 2019 versions reflecting updates in calculation methods and material properties. Based on the DIN 3996 standard, the ISO/TR 14521:2010 (Ref. 9) standard was formed, which provides calculation methods for assessing wear, pitting, worm deflection, tooth breakage and temperature in metal cylindrical worm gears. The standard was withdrawn and replaced in 2020 by the ISO/TS 14521 (Refs. 10, 11), which covers the same failure modes but omits sections related to worm gear geometry and instead references the standard ISO 10828:2024 (Ref. 12) for geometry specifications.
In the field of non-metal gears, the precursor of the VDI 2736: Part 3 guideline is the VDI 2545 (Ref. 13), which was withdrawn in 1996. The 2545 version includes a root stress carrying capacity evaluation method, which was also deemed suitable for use in crossed-helical cylindrical gears and is still proposed in modern gear design software. In the VDI 2736: Part 3 guideline, no comparable root strength rating method is presented, and instead, a fatigue fracture model dependent on the nominal shear stress on the active flank is defined. Since the VDI 2736: Part 3 guideline currently constitutes the state of the art in plastic worm gear rating models, it will be considered in more detail in subsequent sections.
Worm Gear Load-Carrying Capacity Evaluation According to VDI 2736: Part 3
The guideline enables the evaluation of the load-carrying capacity of plastic worm wheels and durability against several key failure mechanisms, typically exhibited by these components during running. A schematic presentation of the complete worm wheel evaluation procedure per noted guideline is shown in Figure 3. As is visible, the complete evaluation procedure is composed of several steps and failure mode criteria, described in more detail in the following pages.
Figure 4—Worm wheel teeth fracture at the tip (addendum) diameter of the worm gear.
Tooth Root Load Carrying Capacity
The guideline presents a model for evaluating worm wheel tooth fracture load-carrying capacity. While the precursor guideline, the VDI 2545, considered bending root stress as the main fatigue failure criterion (leading to root crack induced failure), the updated 2736 guideline assumes that fracture predominantly occurs at the edge of the worm (i.e., at its addendum diameter, see Fig. 4) and considers instead the shear fatigue stress as being the one leading to this type of failure.
According to Wassermann (Ref. 14), a shear fatigue stress safety factor can be introduced as:
(1)
Here τFlim is the shear fatigue strength of the used worm wheel material, while τF is the evaluated nominal shear stress. The guideline assumes that τFlim can be approximated as a fraction of the tensile fatigue strength at the specified operation temperature υM (of which data are more readily available) and recommends to multiply the tensile fatigue strength by a factor of 0.75 to obtain shear strength data. Alternatively, the data could be obtained directly from gear tests as discussed in Section 4.3.3. It is further recommended to consider a minimum safety factor of SFmin ≥ 1.3. The nominal shear stress is calculated as:
(2)
Here Ft2, KA, Yε and Aτ, are the tangential force on the wheel, application factor, contact factor, and shear section area, respectively. Aτ is defined as a radial projection of the fracture area as depicted in Figure 5.
Figure 5—Shear section area Aτ used in the VDI 2736: Part 3 (Ref. 6) fatigue model for nominal shear stress evaluation.
The fatigue fracture model assumes that there is no major wear involved throughout the worm wheel’s life cycle, since wear would influence the shear section area. If measurable wear is identified, a reduced tooth thickness of the wheel should be considered in the calculation, in line with the expected wear rate.
Flank Load-Carrying Capacity
In worm gears, flank pressure is crucial for estimating the overall wheel load-carrying capacity. Hertzian theory is used to calculate this type of pressure, considering the elastic deformation of the contact area. This deformation creates an ellipsoid distribution of the compressive stress, with the maximum stress occurring approximately at the centroid of the contact area (Figure 6).
Figure 6—Ellipsoid shape of the tooth contact at the pitch circle area as calculated using FEA on a typical plastic worm wheel geometry (the simulation was performed for a complete tooth meshing cycle using a non-linear quasi-static time-dependent contact analysis model).
Here, the flank curvature near the contact zone and the material properties of the gears influences the reached flank pressure magnitudes significantly. In line with the above, the average or nominal flank pressure is defined as (Ref. 15):
(3)
where Fn, ZεS, ah, and bh are the normal force, contact factor, major and minor semi-axes of the contact ellipse, respectively. The limit contact stress, σHP, is typically taken from available data in the VDI 2736: Part 2 (Ref. 16) guideline for cylindrical gears, which can however result in insufficient safety factors. In the subsequent section, methods for the characterization of σHP on worm gear pairs is discussed. The normal force can be calculated as follows:
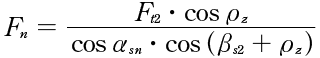
(4)
Here, Ft2,ρz,αsn, and bs2 are the tangential force on the wheel, the frictional angle, the normal pressure angle and the helix angle at the helix circle of the worm wheel. The contact factor is a function of the contact ratio in the normal direction:
(5)
(6)
while the frictional angle is a function of the coefficient of friction μ and normal pressure angle:
(7)
The semi-axes of the contact ellipse are further:
(8)
and are both a function of the elastic properties of the selected material pair:
(9)
the equivalent radius of curvature at helix point, ρn, and empirically defined coefficients η and ξ. ρn is calculated using:
(10)
with ds1,2, db1,2 and bb1,2 being the helix and base circle diameters and the base circle helix angle of both gears in pair. ρn is then evaluated as:
(11)
Efficiency
Worm gear efficiency is, in general, much lower than that of cylindrical spur or helical gears. The efficiency is in effect a function of the coefficient of friction and the worm’s helix angle βs1 (or its complement, the lead angle γm1. If the efficiency drops below 50 percent the worm gear drive is said to be self-locking, meaning that it cannot run if power is applied on the worm wheel to drive the worm. Per VDI guideline, if the input power is introduced on the worm, the efficiency is calculated as:
(12)
Alternatively, if the worm wheel is driving (assuming the pair is not self-locking), the efficiency is:
(13)
Experimental Methods for Material Data Characterization
As noted in the sections “Tooth Root Load Carrying Capacity” and “Flank Load-Carrying Capacity,” the limit stress values τFlim and σHP used for gear rating are obtained based on simplified testing methods, like tensile fatigue data with a normalizing factor for τFlim and rolling contact fatigue data used for cylindrical gears for σHP. For the latter, contact fatigue failure is defined as when pits populate at least 30 percent of the flank contact area. Flank fatigue is generally controlled when designing Polyamide and PBT gears, but not for POM, where root fatigue is generally expected. While these methods offer a good approximation for defining limiting fatigue fracture and contact stresses of worm wheels, they do not accurately represent the phenomenological mechanical behavior of worm wheels during running. It is therefore more advisable to perform experimental characterization of these failure modes in actual gear running conditions. This type of methodology is presented in more detail in the subsequent sections.
Testing Methodologies and Test Rig Setups
There are hence several available methodologies for the characterization of worm wheel materials in terms of the failure mode of interest. The limiting fatigue strength of the material as a function of load and stress can, e.g., be obtained by performing pulsator or tensile fatigue tests on a rig setup as presented in Figure 7. The fatigue strength is characterized as a function of load and sample temperature, which is a highly important parameter also determining the material’s service life. These tests are usually performed in a positive sinusoidal cyclic fatigue load regime defined by the fatigue factor R>0 (Figure 8). While these tests offer a fast and fairly reliable method of fatigue characterization, they can perhaps oversimplify the actual stress state occurring during gear running, which is a rather complex function of the gear geometry, meshing kinematics, contact ratio and load magnitude. Hence, it is advisable to perform tests on a suitable gear test rig, similar to the setup schematically presented in Figure 9. This type of setup applies to both cylindrical and crossed-helical gearings and provides the most realistic load conditions in comparison with actual gear applications.
Figure 7—Pulsator and tensile fatigue test setup used for limit fatigue stress characterization of polymer materials used for worm wheels.Figure 8—Fatigue testing R-factor determines the applied cyclic load regime.Figure 9—Schematic of a general test rig setup suitable for worm gear pair experimental characterization testing.
Test Samples
For comparative tests of different material pairs and lubricants, it is required to employ the same gearing geometry. While no standard exists that would define a specific sample geometry for worm gear tests, the VDI 2736: Part 4 (Ref. 17) guideline recommends a sample geometry initially proposed at the Ruhr University Bochum, Chair of Industrial and Vehicle Drive Technology. The main parameters of this geometry are defined in Table 1.
Parameter
Sign
Unit
Worm
Worm wheel
Center distance
a
mm
29.98/30.02
Axis angle
Σ
°
90
Hand of gear
/
Right
Number of teeth
Z1,2
/
1
40
Pressure angle
αn
°
20
Helix angle
β1,2
°
82,493
7,507
Pitch circle diameter
d1,2
mm
9,568
50,432
Tooth width
b1,2
mm
25
10
Table 1—Base geometry parameters for the testing sample worm gearing geometry defined in Ref. 17.
The defined geometry can be used as a basis for performing material characterization tests to obtain fatigue or flank strength data required for the gear rating calculations described in the previous sections. It is, however, always important to ensure that at the range of testing loads and temperature selected, the failure mode corresponds to the studied strength limit parameter. Different strategies can be introduced to achieve this, but apart from load and temperature, the failure mode is mainly a function of the used lubrication conditions. It is, e.g., possible to avoid unwanted thermal failure at higher loads by introducing a suitable grease for lubrication, which might suffice to reduce the temperature and avoid the material reaching the melting point. Flank fracture, on the other hand, is often exhibited in oil-lubrication conditions (although sometimes even in other lubrication regimes), which therefore requires the testing to be done in such conditions as well.
Case study—Experimental Characterization of a PA Compound Worm Wheel
Overview
A case study was performed to examine the viability of the material characterization procedures using worm gear tests and assess how variable failure modes can be analyzed using a selected gear pair geometry. In the presented case, a worm gear with a gear ratio of i=21 and module m=2 mm. Here, the worm wheel was produced using a specific type of polyamide (PA) compound in pair with a steel worm. The goal of the study was to characterize the fatigue and wear performance of the tested worm wheel material paired with the selected steel in both dry and grease-lubricated conditions.
Figure 10—General-purpose worm gear test rig (GTR-170 model byRD Motion) used for the case study tests. The test rig is suitable for performing lifetime gear tests and failure mode-dependent limiting material strength characterization.
Thermal Failure
Initial tests were executed in dry running conditions with temperature control, at an output load on the wheel of 50 Nm and 100 rpm speed. Even at such moderate load conditions, the generated heat losses (combined with thermally induced wear) were exceedingly high, leading to imminent thermal failure (Figure 11). Based on these results, it was concluded that continuous running tests could only be executed in lubricated conditions and possibly at a lower running speed for thermal failure to be avoided and other failure mechanisms to develop.
Figure 11—Thermal failure on the worm wheel run in dry, non-lubricated conditions.
Fatigue Characterization
Tests in grease-lubricated conditions were subsequently carried out at an output speed of 60 rpm. A suitable grease for the used material pair can decrease the coefficient of friction to such a degree that thermal overload can be avoided and a quasi-steady thermal state at a selected temperature can be achieved. Combined with suitable active temperature control, which on the used rig is achieved by integrating a thermal spot sensor yielding the reference sample temperature, conditioned air inflow and an active PID-based control algorithm, it was possible to retain the worm wheel temperature at room level, i.e., 23 ± 4°C even at higher output torques. For accurate temperature measurements, it is important to account for any influence of the used lubricant on the surface emissivity. For the grease used, the emissivity was found to be very close to the emissivity of the polymer, i.e., approximately ε = 0.95. The results from the fatigue characterization testing presented in the form of an S-N curve as typically used in design and rating models as the one defined in the VDI 2736: Part 3 guideline, are shown in Figure 12 (plotted for 50 percent failure probability in line with Ref. 17). The observed failure mode throughout the range of testing loads was, rather surprisingly, root fatigue, where the location of fatigue crack nucleation was at the root below the active tooth flank (Figure 13). Since the worm wheel was composed of two polymers (i.e., it was a two-component injection-molded part), there could have been an influence of the transition between the two materials at the gear rim on the root fatigue failure. Due to this material configuration, the rim thickness of the first (gearing) material was reduced, which could have hastened the root crack nucleation at the root diameter.
Figure 12—Generated S-N curve for the tested worm gear pair (torque data confidential and cannot be disclosed at the time of writing).Figure 13—Fatigue crack nucleation location as commonly exhibited during the performed tests.
The exhibited failure mode falls outside of the assumptions laid out for the fatigue model described in the VDI guideline for worm wheels, where fracture at the flank as a function of shear stresses is predicted (see the section “Tooth Root Load Carrying Capacity”). The obtained results underline the necessity for a thorough revision and expansion of current state-of-the-art guidelines to account for and model other types of failure modes, which can indeed occur in certain material/lubrication/load configurations.
Wear Characterization
While wear rate prediction models are not presented in the VDI guideline for worm gears (even though such a model is defined for cylindrical gears), wear can, notwithstanding, be an important damage mode that can itself lead to failure or contribute to other failure modes like tooth fracture. In general, the same two categories of wear characterization methods could be used, i.e., the gravimetric (weight-loss) or geometric (tooth thickness reduction) types of methods. While wear can be described in terms of weight loss, due to a lack of suitable conversion models for evaluating the wear rate based on these measurements, currently, the thickness reduction method is preferred. An additional benefit of using the latter is that it enables measurements in any type of lubrication regime, while the gravimetric method is only valid for dry running conditions.
Still, the thickness reduction method poses several challenges, mostly in terms of reducing measurement uncertainty, which can result from:
Location of measurement variation in the lead direction
Angular deviations of the measurement tool relative to the tooth
Variations in the diameter or height of measurement (in general measurements should be done at the reference circle diameter)
Other operator-related errors
The noted sources of error can influence the measurements noticeably. It is therefore important to ensure repeatable measurement conditions and avoid any other external influences and decrease the measurement uncertainty to the highest degree possible. To achieve consistent results, the measurements should be executed on an appropriate bench with positioning tables, while the measurement tool should be suitably calibrated and with high enough resolution to allow for micron-level accuracy. In our example, a Mitutoyo GMA-25MX micrometer was used for the task. Figure 15 shows results obtained from three tests executed at 60 Nm in grease lubricated running conditions.
Figure 15—Tooth thickness reduction resulting from wear measured during three tests run in grease-lubricated conditions at 60 Nm. (Achieved running cycle data cannot be disclosed at the time of writing.)
Thermal Measurements
In lifetime gear tests carried out for root/flank fatigue or wear characterization, temperature is a key parameter that must be accounted for, since the mechanical properties and durability of polymers are highly dependent on it. These types of lifetime tests should, in most cases, be carried out at controlled temperatures to distinguish between the influence of the specified load and temperature on the service life of the gear pair. Temperature control (i.e., the retention of a gear sample at a selected temperature) can only be imposed if a suitable thermal measurement system is integrated into the test rig. To obtain consistent measurements, the sensors must be calibrated, the measured material emissivity correctly accounted for and the measurement position precisely specified. Per VDI (Ref. 17), the measurement location is defined to be at one quarter of the wheel’s face width, on the active (i.e., meshing) flank side where the temperature is the highest (Figure 16a). IR thermal sensors, i.e., spot sensors or thermal cameras, are commonly used to measure the temperature as described. Figure 16b shows measurements obtained using an Optris Xi 80 thermal camera on a PA worm wheel run at 60 Nm in grease lubricated conditions without any active temperature control (i.e., the temperature is allowed to increase organically due to generated frictional/hysteresis heat losses). In this case, the camera was positioned almost perpendicularly to the wheel. An additional thermal sensor was positioned fully in line with the VDI specifications to measure the temperature on the active flank side. The difference in measured temperatures between both sensors is shown in Figure 17. The variation between VDI-specified measurement method and the thermal camera measurement was, in this case, a substantial 11 percent. The results underscore the importance of defining and adhering to measurement setup specifications to obtain compliant and comparable results in the type of tests described.
Figure 14—Geometric tooth thickness reduction (a) and gravimetric (b) wear measurement methods.Figure 16—Thermal measurements executed on a worm wheel. a) VDI-specified measurement location and b) measurements executed on a worm wheel using a thermal camera.Figure 17—Difference in measured temperature between thermal camera positioned radially to the sample (Figure 16b) and a thermal spot sensor positioned as prescribed in the VDI guideline.
Ultimate Torque Fracture Testing
Worm gear drives are often required to withstand only short operation lifetimes, with cycle-to-failure numbers below NL=103 (sometimes this number can be in the 101 range). In such cases, the ultimate (or peak) torque Tsp and correlated ultimate local root stress σFP,s (Ref. 16) need to be evaluated. Here, σFP,s is a function of the polymer’s yield stress σS and is defined as:
(14)
Here, the factor 2 accounts for an overstress capacity of the tooth relative to a tensile coupon due to a bending stress redistribution phenomenon (SSmin is a safety factor; typically, 1.5.) σFP,s is defined for cylindrical gears, however the same assumptions can be considered valid for worm wheels.
It is also possible to obtain experimental σFP,s data directly on the gear geometry. To this end, universal mechanical testing devices with suitable mounting jigs for applying suitable loads on the worm wheel can be used. Alternatively, purpose-built test rigs can be employed. The test rig shown in Figure 18 provides the required torque overload via the worm, while the worm wheel is fully fixed. In this setup, the failure is achieved in one sweep of the worm tooth in contact with the tested tooth on the fixed wheel. The device therefore enables direct measurement of σFP,s in realistic application load conditions. A similar testing method was used by Jiaxing et al. (Ref. 18). A slightly different variation of this testing approach, which instead uses a universal testing device for mounting the worm and applying a tangential force on the wheel, was presented by Shi et al. (Ref. 19).
Figure 18—Ultimate-torque test rig (STR model by RD Motion).
Conclusion
The paper presents the current state-of-the-art in plastic worm gear design and load-carrying capacity rating. The VDI 2736: Part 3 guideline is studied as a reference, since it provides the most comprehensive set of models and data for worm wheel calculations. Based on an executed case study, it was found that the guideline, while fairly comprehensive, lacks suitable models and methods for the characterization of root fatigue and wear as exhibited in the tested polymer worm wheel. Root fatigue was found to be a driving failure mode in the executed study, instead of tooth fracture across the worm’s tip diameter as assumed in the VDI guideline. Furthermore, the results showed the necessity for a suitable wear rate model similar to the one presented for cylindrical gears in VDI 2736: Part 2, since significant wear was measured even in grease lubricated conditions. Overall, the study further attests to the fact that a more comprehensive worm gear standard would be required for the load-carrying capacity analysis that would take into consideration various material/lubrication/geometry/load configurations and would also provide more comprehensive material data for the wealth of available engineering polymers employed in such applications.
References
M. Nomura, T. Koide, A. Ueda, and A. Tamura, “318 Fatigue Life Prediction of Plastic Helical Wheels Meshed with Various Types of Worms,” The Proceedings of Conference of Chugoku-Shikoku Branch, Vol. 2015.53, p. 318-1, 2015. doi: 10.1299/jsmecs.2015.53._318-1.
G.-H. Kim, J.-W. Lee, and T.-I. Seo, “Durability Characteristics Analysis of Plastic Worm Wheel with Glass Fiber Reinforced Polyamide,” Materials (Basel), Vol. 6, No. 5, pp. 1873–1890, May 2013. doi: 10.3390/ma6051873.
K. M. Marshek and P. K. C. Chan, “Qualitative Analysis of Plastic Worm and Worm Gear Failures,” Wear, Vol. 66, No. 3, pp. 261–271, Feb. 1981. doi: 10.1016/0043-1648(81)90120-4.
K. M. Marshek and P. K. C. Chan, “Wear Damage to Plastic Worms and Gears,” Wear, Vol. 44, No. 2, pp. 405–409, Sep. 1977. doi: 10.1016/0043-1648(77)90154-5.
E. Chakroun et al., “Numerical and Experimental Study of the Dynamic Behaviour of a Polymer-Metal Worm Drive,” Mechanical Systems and Signal Processing, Vol. 193, p. 110263, Jun. 2023. doi: 10.1016/j.ymssp.2023.110263.
VDI 2736–Part 3, Thermoplastic gear wheels–Crossed helical gears–Mating cylindrical worm with helical gear–Calculation of the load-carrying capacity. 2014.
VDI 2736–Part 1, Thermoplastic gear wheels–Materials, material selection, production methods, production tolerances, form design. 2016.
Miltenovic, M. Banic, and Đ. Miltenović, “Load Capacity of Cylindrical Worm Gears According to DIN 3996-2012,” Machine Design, Vol. 9, pp. 45–50, Jun. 2017. doi: 10.24867/MD.9.2017.2.45-50.
ISO/TR 14521:2010, Gears—Calculation of load capacity of worm gears, International Organization for Standardization, 2010. [Online]. Available: https://www.iso.org/standard/51227.html. Accessed: May 16, 2024.
ISO/TS 14521:2020, Gears—Calculation of load capacity of worm gears, International Organization for Standardization, 2020. [Online]. Available: https://www.iso.org/standard/77340.html. Accessed: May 16, 2024.
P. E. Schnetzer, J. Pellkofer, and K. Stahl, “Calculation method for wear of steel-bronze rolling-sliding contacts relating to worm gears,” Forsch Ingenieurwes, Vol. 87, No. 3, pp. 961–971, Sept. 2023. doi: 10.1007/s10010-023-00692-5.
ISO 10828:2024, Worm gears—Worm profiles and gear mesh geometry, International Organization for Standardization, 2024. [Online]. Available: https://www.iso.org/standard/82651.html. Accessed: May 16, 2024.
VDI 2545–Gear wheels made from thermoplastics. 1981.
J. Wassermann, Einflussgrößen auf die Tragfähigkeit von Schraubradgetrieben der Werkstoffpaarung Stahl/Kunststoff. Diss. Ruhr-Universität Bochum, 2005.
S. Oberle, Tragfähigkeit und Ausfallursachen von Kunststoffzahnrädern, Tagungsband Maschinenelemente aus Kunststoff. Lehrstuhl für Kunststofftechnik (LKT) der Universität Erlangen, 2008.
VDI 2736–Part 2, Thermoplastic gear wheels–Cylindrical gears–Calculation of the load-carrying capacity. 2014.
VDI 2736–Part 4, Thermoplastic gear wheels–Determination of strength parameters on gears. 2016.
Z. Jiaxing and K. Ilie, “Static shear strength calculation of plastic helical gears mating with steel worm,” Int. J. Precis. Eng. Manuf., Vol. 15, No. 2, pp. 235–239, Feb. 2014. doi: 10.1007/s12541-014-0330-0.
Z. Shi, J. Ren, Z. Feng, and J. Li, “Key Technology and Experimental Study of Unequal Pitches Meshing between Metal Worm and Plastic Helical Gears,” Applied Sciences, Vol. 11, No. 1, Jan. 2021. doi: 10.3390/app11010333.
First presented at the 2024 Fall Technical Meeting (FTM), October 7–9, 2024, Rosemont, IL. Printed with permission of the author(s). Statements presented in this paper are those of the author(s) and may not represent the position or opinion of the American Gear Manufacturers Association.