This study explores the failure mode morphology of FZG-A test gears. It aims to examine the morphologies of scuffing, scoring, scratches, and polishing using high-magnification light optical microscopy (LOM) and scanning electron microscopy (SEM) images.
For closer inspection of the full-size figures in this technical article, please follow the link below: geartechnology.com/fzg-a-figures
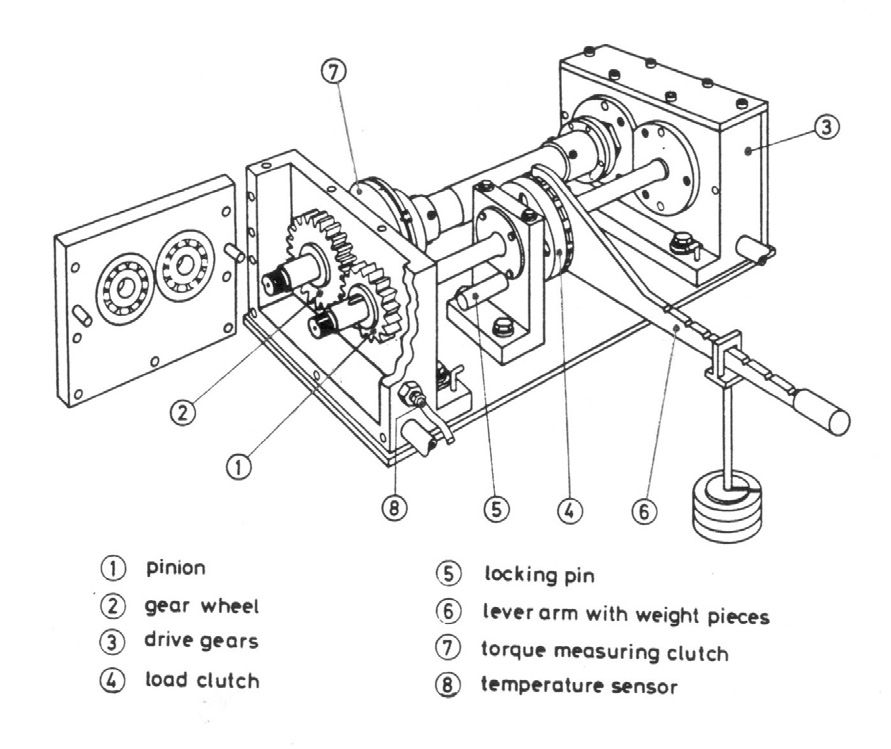
The FZG-A test rig is described, including specifications for the test procedures according to the industrial standards ISO 14635-1 (Ref. 1), ASTM 5182-19 (Ref. 2), and CEC L-07-95 (Ref. 3). These three standards are considered technically equivalent.
Description of Figure 1
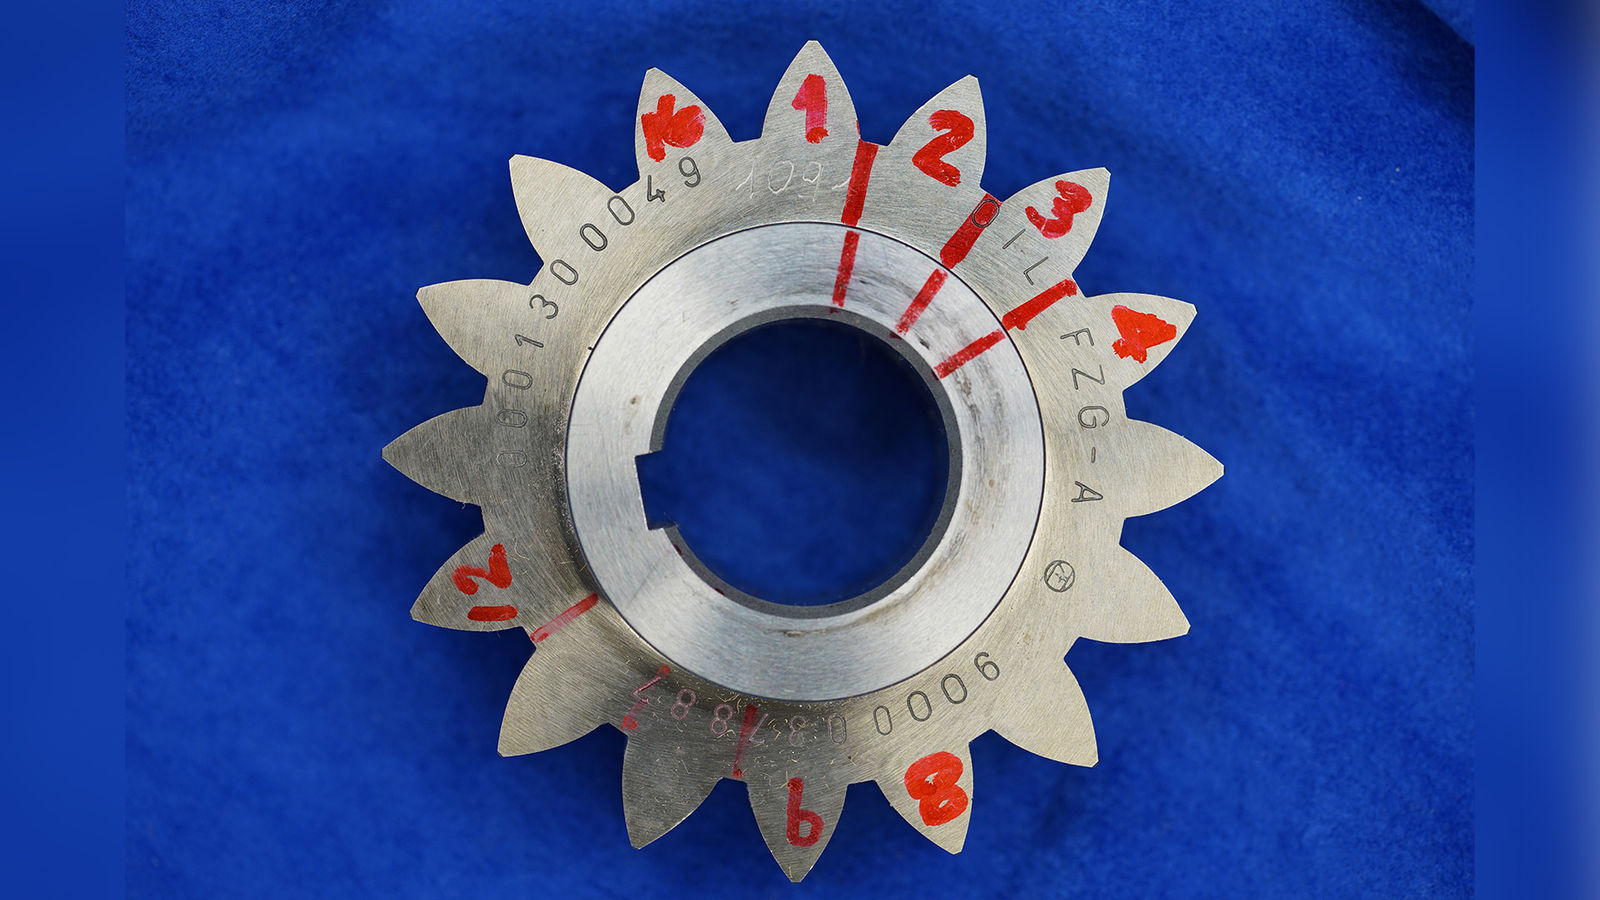
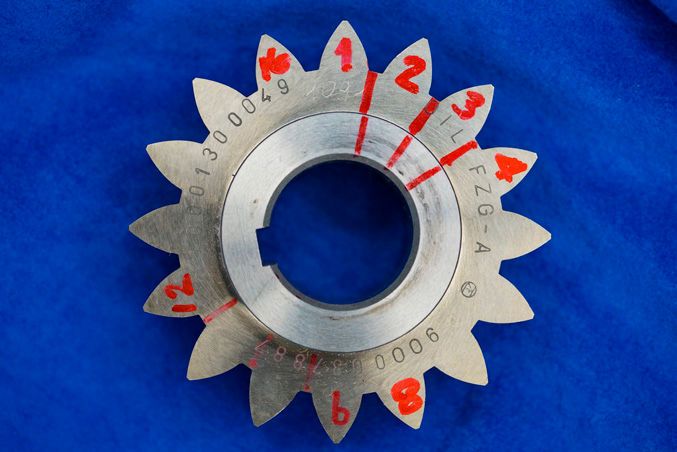
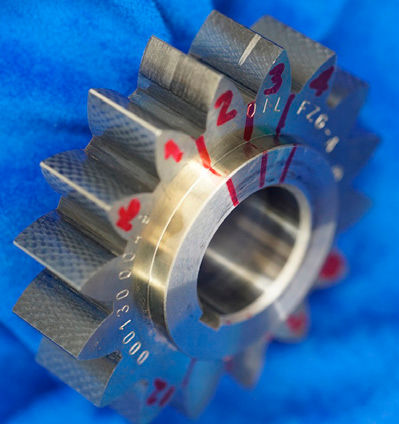
Figure 1 illustrates an FZG-A spur pinion with 16 teeth that meshes with a spur gear featuring 24 teeth. Detailed geometric information about both the pinion and the gear can be found in Annex A. For the LOM and SEM investigation, teeth 2 and 3 were removed by cutting along the red radial lines indicated in the figure.
Figure 1—FZG-A Pinion.
Description of Figure 2
Figure 2 illustrates scuffing on teeth 2 and 3. Tooth 2 exhibits scuffing nearly across the entire face width, while tooth 3 shows a narrow band of scuffing. The other teeth, which do not exhibit scuffing, display the unique surface texture produced by the MAAG 15-degree crisscross grinding method.
Figure 2—Typical scuffing on teeth 2 and 3.
Description of the FZG-A Test
The FZG-A gear test consists of twelve 15-minute stages, each with increasing load, until scuffing occurs or the testing sequence is completed. After load stage 4, and at the end of each subsequent stage, the pinion tooth flanks are visually inspected for signs of scuffing, which are recorded. The visual inspection is done without removing the gears from the test rig, and without the aid of magnification. The test concludes when the summed total width of scuffing on all 16 pinion teeth exceeds 20 mm, and the failure load stage is reported. If load stage 12 is completed without any scuffing, the failure load stage is reported as greater than 12.
FZG-A Failure Mode
Four failure modes can occur in FZG-A test gears, including scuffing, scoring, scratches and polishing. ASTM 5182-19 defines the failure modes as follows:
Scuffing—wear due to localized bonding between contacting solid surfaces leading to material transfer between the two surfaces or loss from either surface.
Scoring—a severe form of wear characterized by the formation of extensive grooves and scratches in the direction of sliding.
Scratches—the result of mechanical removal or displacement, or both, of material from a surface by the action of abrasive particles or protuberances sliding across the surfaces.
Polishing—a mild form of abrasive wear resulting in minor loss of material and typically characterized by a smooth finish and removal of all or part of the initial grinding marks.
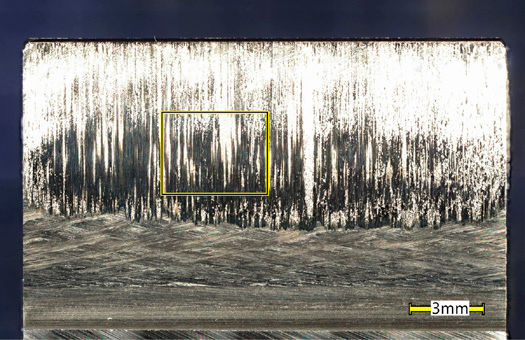
Description of Figure 3
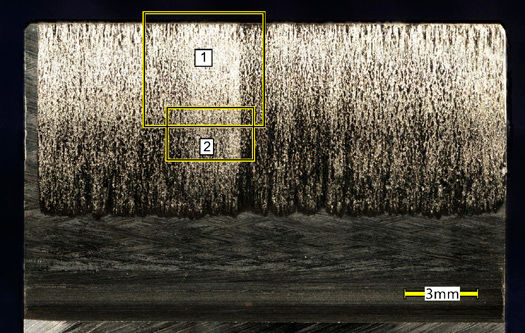
Figure 3 shows the scuffing observed on tooth 2, which is also illustrated in Figure 2. The scuffing measures 19.5 mm in width, almost covering the total face width of 20 mm. To the unaided eye, or when viewed under LOM, the scuffed area appears as a dull grey surface.
An enlarged SEM image of Box 1 is shown in Figure 4, followed by a series of SEM images of Box 2 at progressively higher magnifications.
Figure 3—LOM image of tooth 2 shown in Figure 2.
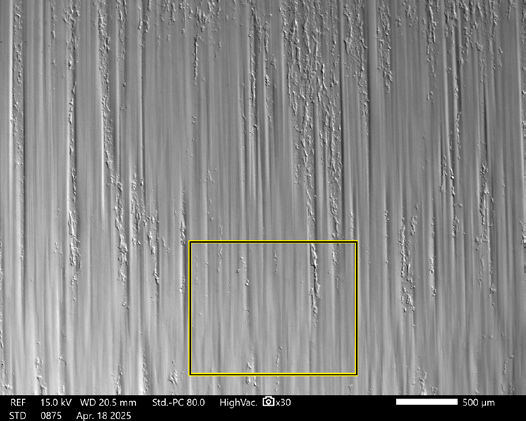
Description of Figure 4
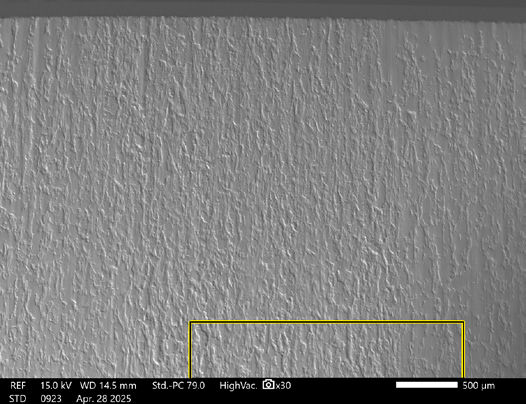
Figure 4 shows that scuffing results in a rough surface, which covers the original grinding marks. The top of Box 2 is shown at the bottom of Figure 4 and in Figure 5.
Figure 4—SEM image of Box 1 shown in Figure 3.
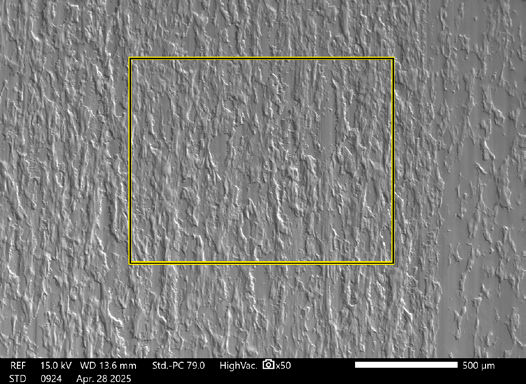
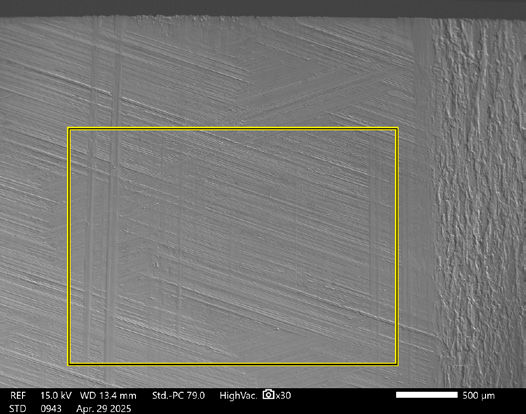
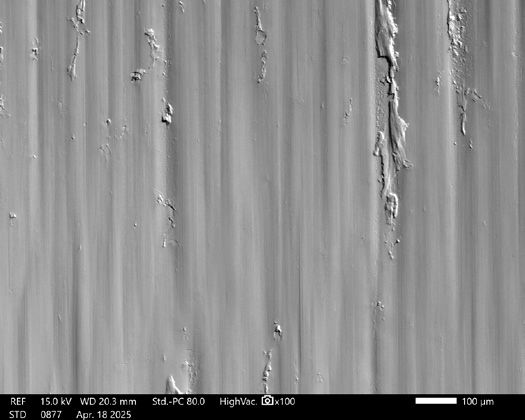
Description of Figure 5
Figures 5 through 8 are SEM images of scuffing shown at progressively increasing magnification from 50× to 750× magnification.
Figure 5—SEM image of Box 2 shown in Figure 3.
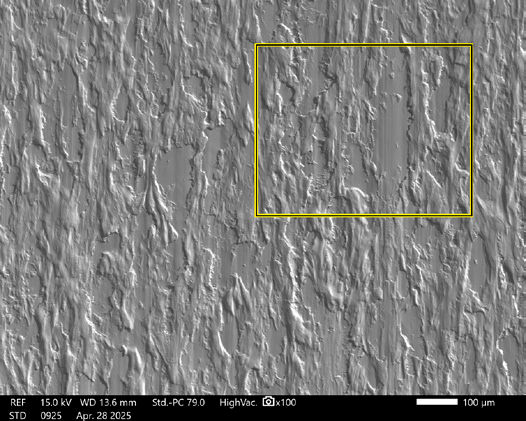
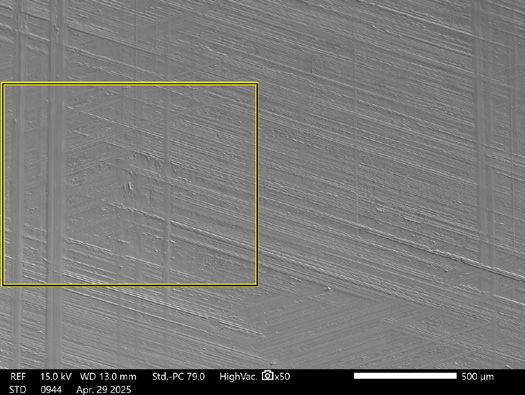
Description of Figure 6
[advertisement]
Figure 6 illustrates the area of the Box depicted in Figure 5. The area within the Box in Figure 6 is represented in the subsequent Figure 7.
Figure 6—SEM image of Box shown in Figure 5.
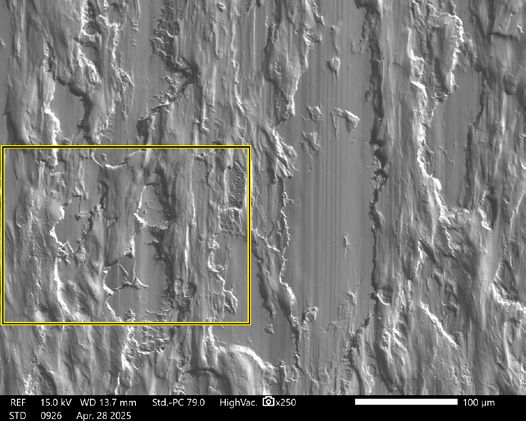
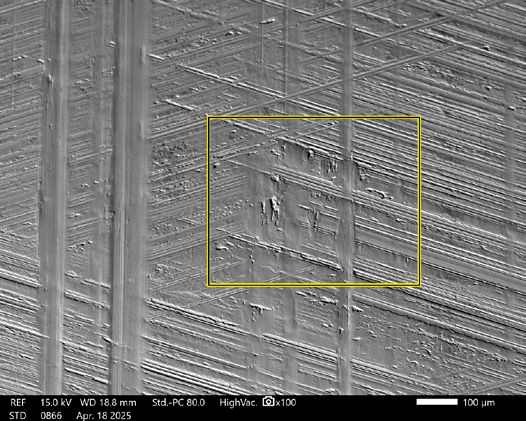
Description of Figure 7
Figure 7 shows the area of the Box shown in Figure 6. The area within the Box in Figure 7 is represented in the subsequent Figure 8.
Figure 7—SEM image of Box shown in Figure 6.
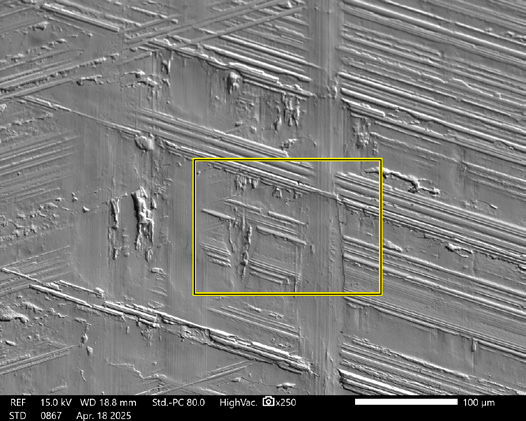
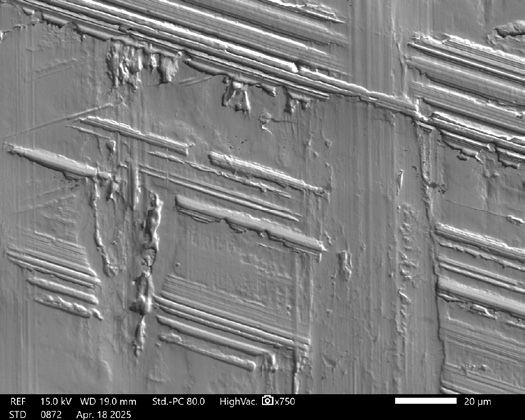
Description of Figure 8
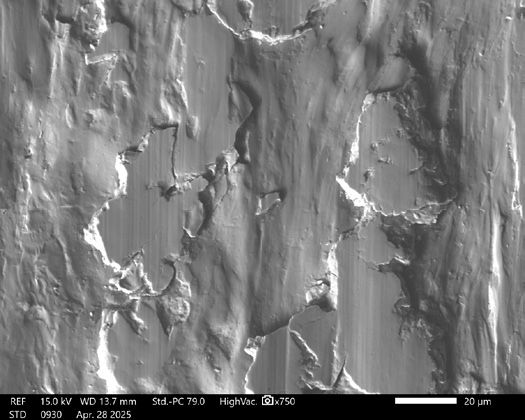
Figure 8 shows the area of the Box shown in Figure 7. It illustrates the morphology of the transferred particles, which appear as discrete islands of raised patches. These patches were transferred from the meshing flanks of the wheel and welded onto the pinion flanks. The top surfaces of these patches have become smooth due to abrasive wear, as shown by the abrasion lines that run in the vertical sliding direction. The tractional shear stresses associated with this abrasion have led to the formation of several cracks within the transferred patches. If the shear stress on the top surface of a transferred patch exceeds the shear strength of the weld interface on its lower surface, the patch may dislodge and become a freed debris particle.
Figure 8—SEM image of Box shown in Figure 6.
Description of Figure 9
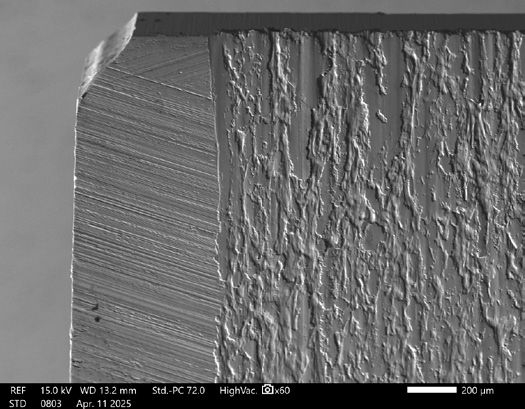
Figure 9 illustrates the left corner of tooth 2, where scuffing does not extend to the left end of the face width. The original grind marks are visible in the area that remains free of scuffing. Additionally, plastic deformation of the transferred material has flowed over the tip of the tooth.
Figure 9—SEM image of left corner of tooth shown in Figure 3.
Description of Figure 10
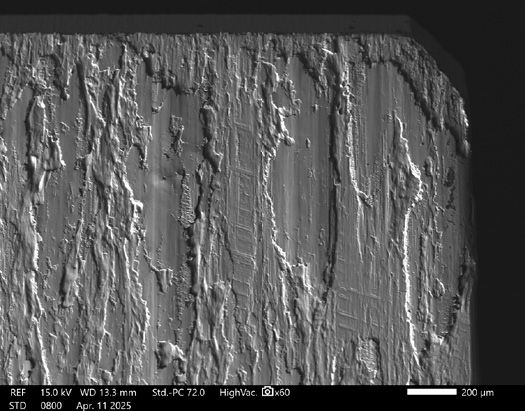
Figure 10 illustrates that the transferred patches are elevated above the original ground surface of the tooth flank. As a result, the load is carried exclusively by these transferred patches, while the areas of the original ground flank are unloaded. This situation leads to self-aggravating scuffing.
Figure 10—SEM image of right corner of tooth shown in Figure 3.
Description of Figure 11
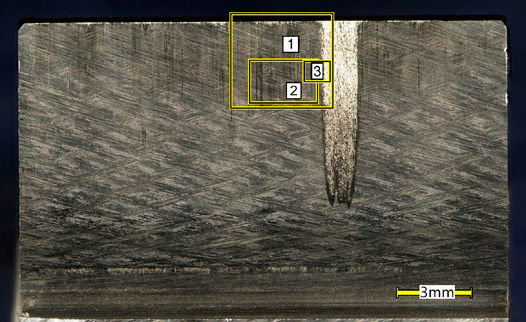
Figure 11 illustrates a 1.4 mm-wide band of scuffing that starts at the lower part of the tooth and extends up to its tip. Additionally, there is a narrow band of scuffing along the edge of the tooth tip and a narrow band of scuffing near the root of the tooth, at the start of the active profile (SAP). FZG-A gears lack tip or root relief on their profiles, which leads to high loads at both the SAP and the end of the active profile (EAP) at the tips of the pinion teeth. This condition increases the likelihood of scuffing in these areas.
The three Boxes labeled 1, 2, and 3 designate areas for the following SEM images.
Figure 11—LOM image of tooth 3 shown in Figure 2.
Description of Figure 12
Figure 12 shows the area of Box 1 that includes the tip of the tooth at the top of the image and the edge of the scuffing at the right side of the image. The Box in Figure 12 corresponds to Box 2 in Figure 11. The area within the Box in Figure 12 is represented in the subsequent Figure 13.
Figure 12—SEM image of Box 1 shown in Figure 11.
Description of Figure 13
Figure 13 shows the area of Box 2 at a 50× magnification. Prominent vertical lines, which indicate abrasive wear, are clearly visible. In the background, the original crisscross grinding marks can still be seen, offering insight into the depth of the abrasive wear. The area within the Box in Figure 13 is represented in the subsequent Figure 14.
Figure 13—SEM image of Box 2 shown in Figure 12.
Description of Figure 14
Figure 14 provides an enlarged view of the Box depicted in Figure 13. The vertical lines of abrasive wear have erased the original grinding marks. Additionally, the Box in Figure 14 highlights an area of localized scuffing and plastic deformation. The area within the Box in Figure 14 is represented in the subsequent Figure 15.
Figure 14—SEM image of Box 2 shown in Figure 13.
Description of Figure 15
Figure 15 presents an enlarged view of the Box shown in Figure 14. It illustrates scuffing and plastic deformation of the surface material, which has removed the original grinding marks in certain areas. Additionally, the Box in Figure 15 highlights an area of localized plastic deformation. The area within the Box in Figure 15 is represented in the subsequent Figure 16.
Figure 15—SEM image of Box 2 shown in Figure 14.
Description of Figure 16
Figure 16 provides a closer view of the Box depicted in Figure 15. Plastic deformation has caused the surface material to flow upward into the original grind marks, aligning with the upward direction of the sliding motion on the pinion tooth.
Figure 16—SEM image of Box 2 shown in Figure 15.
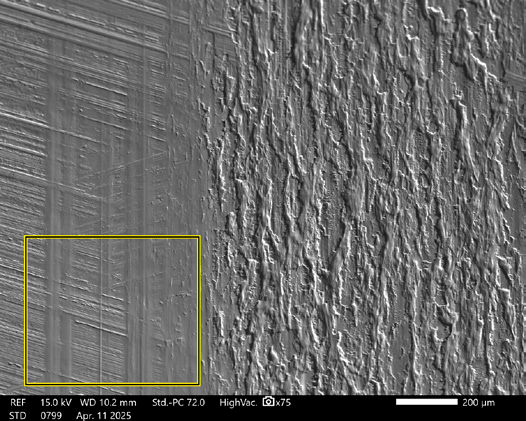
Description of Figure 17
Figure 17 shows the area of Box 3 from Figure 11, emphasizing the scuffed region on the right side of the image and the signs of abrasive wear on the left. The Box in Figure 17 outlines an area that exhibits scoring, scratches, and polishing.
Figure 17— SEM image of Box 3 shown in Figure 11.
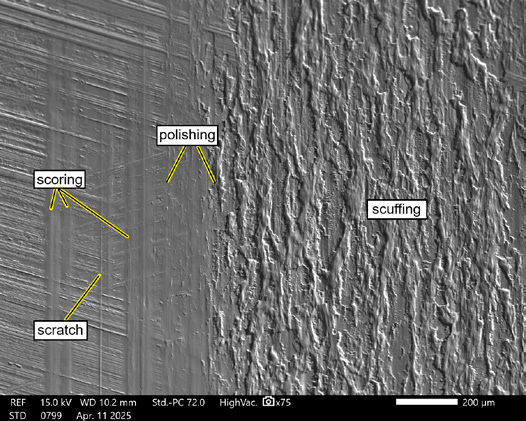
Description of Figure 18
Figure 18 is identical to Figure 17, but it has been annotated to highlight the failure modes of scuffing, scoring, scratches, and polishing. It is evident that scoring and scratches share the same morphology; however, they differ in width.
Figure 18—SEM image with labeled features of interest from Figure 17.
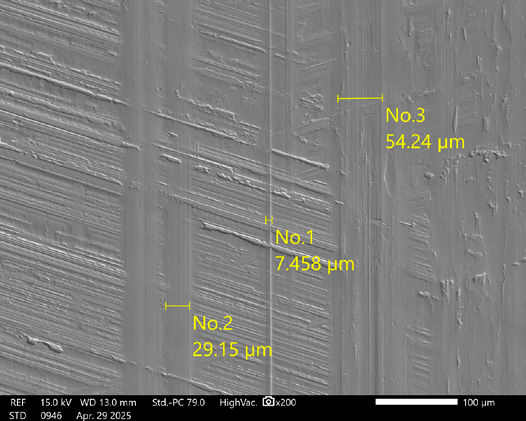
Description of Figure 19
Figure 19 presents an enlarged view of the Box shown in Figure 17. Figure 19 shows that scoring and scratches exhibit similar abrasive wear patterns, characterized by smooth, clean furrows that align with the direction of sliding. However, under intense oblique light, scratches become more noticeable due to specular reflection. Generally, scratches are typically less than 30 µm wide, while scoring is usually wider than 30 µm.
Figure 19—SEM image of Box 3 shown in Figure 17.
Description of Figure 20
Figure 20 shows that tooth 8 has scuffing and polishing. The Box shown in Figure 20 outlines an area of polishing. The area within the Box in Figure 20 is represented in the subsequent Figure 21.
Figure 20—LOM image of tooth 8 shown in Figure 1.
Description of Figure 21
Figure 21 shows the area of the Box depicted in Figure 20. It predominantly features polishing along with some lightly scuffed areas. The Box represented in Figure 21 is displayed at a higher magnification in Figure 22.
Figure 21—SEM image of Box shown in Figure 20.
Description of Figure 22
Figure 22 shows the area of the Box referenced in Figure 21. Polishing wear has completely removed the original grinding marks, resulting in a smooth, mirrorlike surface finish. If the scuffing is not too severe, and the operating conditions remain stable, polishing wear can give the appearance of healing the scuff marks. However, it is important to note that the polished surface shows undulations, with scuffing occurring at the peaks of these undulations. Therefore, while polishing can improve surface appearance, it can also be harmful if it removes a significant amount of surface material.
Figure 22—SEM image of Box shown in Figure 21.
Conclusions
The morphology of scuffing is characterized by transferred particles, which appear as discrete islands of raised patches. The patches are transferred from the meshing flanks of the wheel and welded onto the pinion flanks.
Scoring and scratches exhibit similar abrasive wear patterns, characterized by smooth, clean furrows that align with the direction of sliding. However, under intense oblique light, scratches become more noticeable due to specular reflection. Generally, scratches are typically less than 30 µm wide, while scoring is usually wider than 30 µm.
Polishing results in a smooth, mirrorlike surface finish. If the scuffing is not too severe, and the operating conditions remain stable, polishing wear can give the appearance of healing the scuff marks. However, it is important to note that the polished surface shows undulations, with scuffing occurring at the peaks of these undulations.
Appendix A
Figure A1—FZG Test Machine.
Item
Symbol
Unit
Pinion
Wheel
Center distance
a
mm
91.5
Number of pinion teeth
z1
---
16
Number of gear teeth
z2
---
24
Normal module
mn
mm
4.5
Normal pressure angle
αn
deg
20
Helix angle
β
deg
0
Face width
b
mm
20
Pinion profile shift coefficient
x1
---
0.8635
Gear profile shift coefficient
x2
---
-0.5103
Pinion tip diameter
da1
mm
88.7
Gear tip diameter
da2
mm
112.5
Material alloy
---
---
20MnCr5
Heat treatment
---
---
Carburized
Flank surface roughness
Ra
μm
0.35 ± 0.1
0.30 ± 0.1
Pitchline velocity
vt
m/s
8.3
Table A1—Data for FZG-A test gears.
References
ISO 14535-1, “Gears-FZG test procedures- Part 1: FZG test method A/8.3/90 for relative scuffing load-carrying capacity of oils.”
ASTM D 5182-19, “Standard Test Method for Evaluating the Scuffing Load Capacity of Oils (FZG Visual Method).”
CEC L-07-A-95, “Load Carrying Capacity Test for Transmission Lubricants (FZG Test Rig).”