[advertisement]
Feature Articles

July 26, 2026

Mark E Cowan


Features

Next-Generation Bevel Gear Metrology

Unified surface and geometry analysis in a single inspection cycle

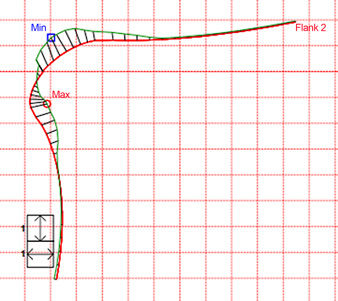
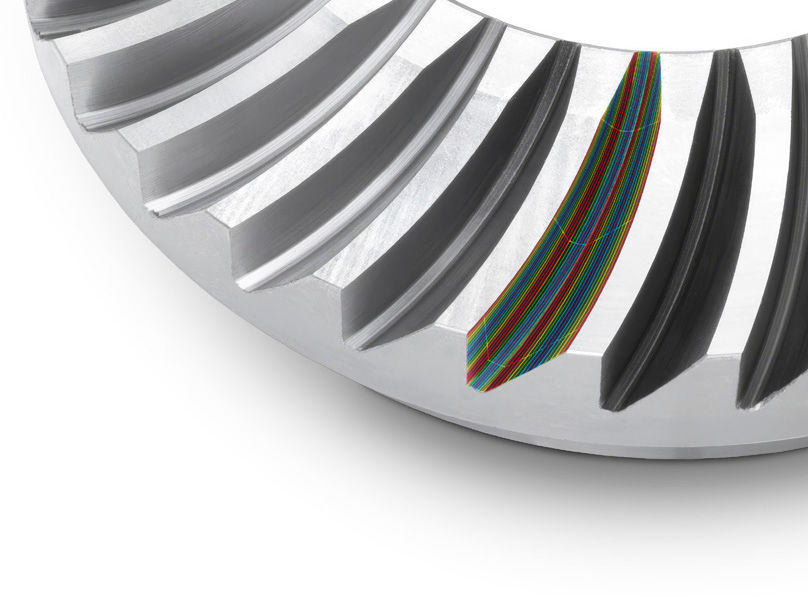
Modern bevel gear manufacturing increasingly requires inspection systems that go beyond traditional flank form evaluation. Surface-related characteristics—particularly waviness and roughness—play a critical role in defining gear performance under load, directly influencing noise behavior, efficiency, and fatigue life.

Conventional measurement of these parameters typically relies on specialized surface roughness instruments when high-resolution roughness evaluation is required. However, this approach often introduces additional complexity, longer inspection times, and the need for separate measurement setups.

This article presents new measurement capabilities that enable accurate and efficient assessment of waviness and form using industry-standard spherical probe tips. By eliminating the need for dedicated surface roughness hardware, these advancements streamline the inspection process while maintaining high measurement fidelity, ultimately supporting faster diagnostics and improved manufacturing efficiency.

Separation of Form Error, Waviness, and Surface Roughness

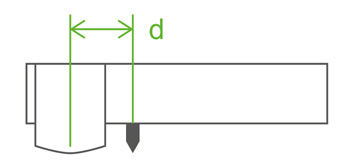
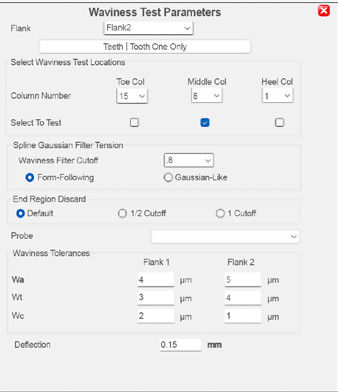
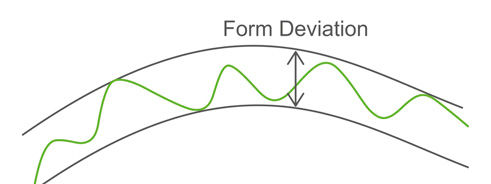
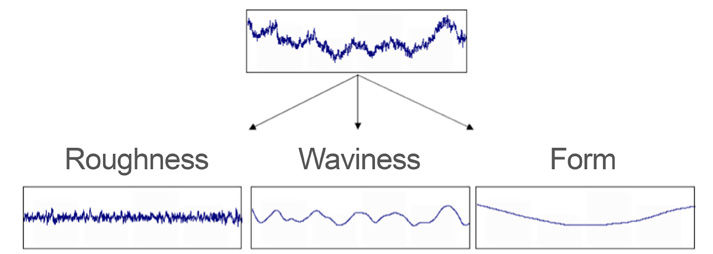
A fundamental requirement of surface characterization is the clear separation of form error, waviness, and surface roughness. International standards define a cutoff wavelength—typically 0.8 mm (λc)—to distinguish between these components. Deviations with wavelengths exceeding this cutoff are classified as waviness, while shorter wavelength deviations are attributed to surface roughness. Accurate surface roughness evaluation, therefore, requires the systematic removal of both form and waviness components through appropriate filtering techniques.

Figure 1—Conceptually illustrates the separation using filtered surface profiles. (All images: Gleason Corporation)
Figure 1—Conceptually illustrates the separation using filtered surface profiles. (All images:Gleason Corporation)

Limitations of Roughness-Derived Waviness

Surface roughness measurement requires a significantly higher sampling density, which directly impacts scanning speed due to limitations in data acquisition rates (samples per second). While surface roughness analysis typically involves the collection of many thousands of data points, waviness evaluation can be performed with substantially fewer samples. As a result, the increased data density required for roughness measurements can limit the achievable scan length and reduce overall inspection efficiency.

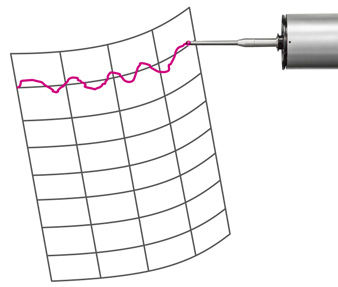
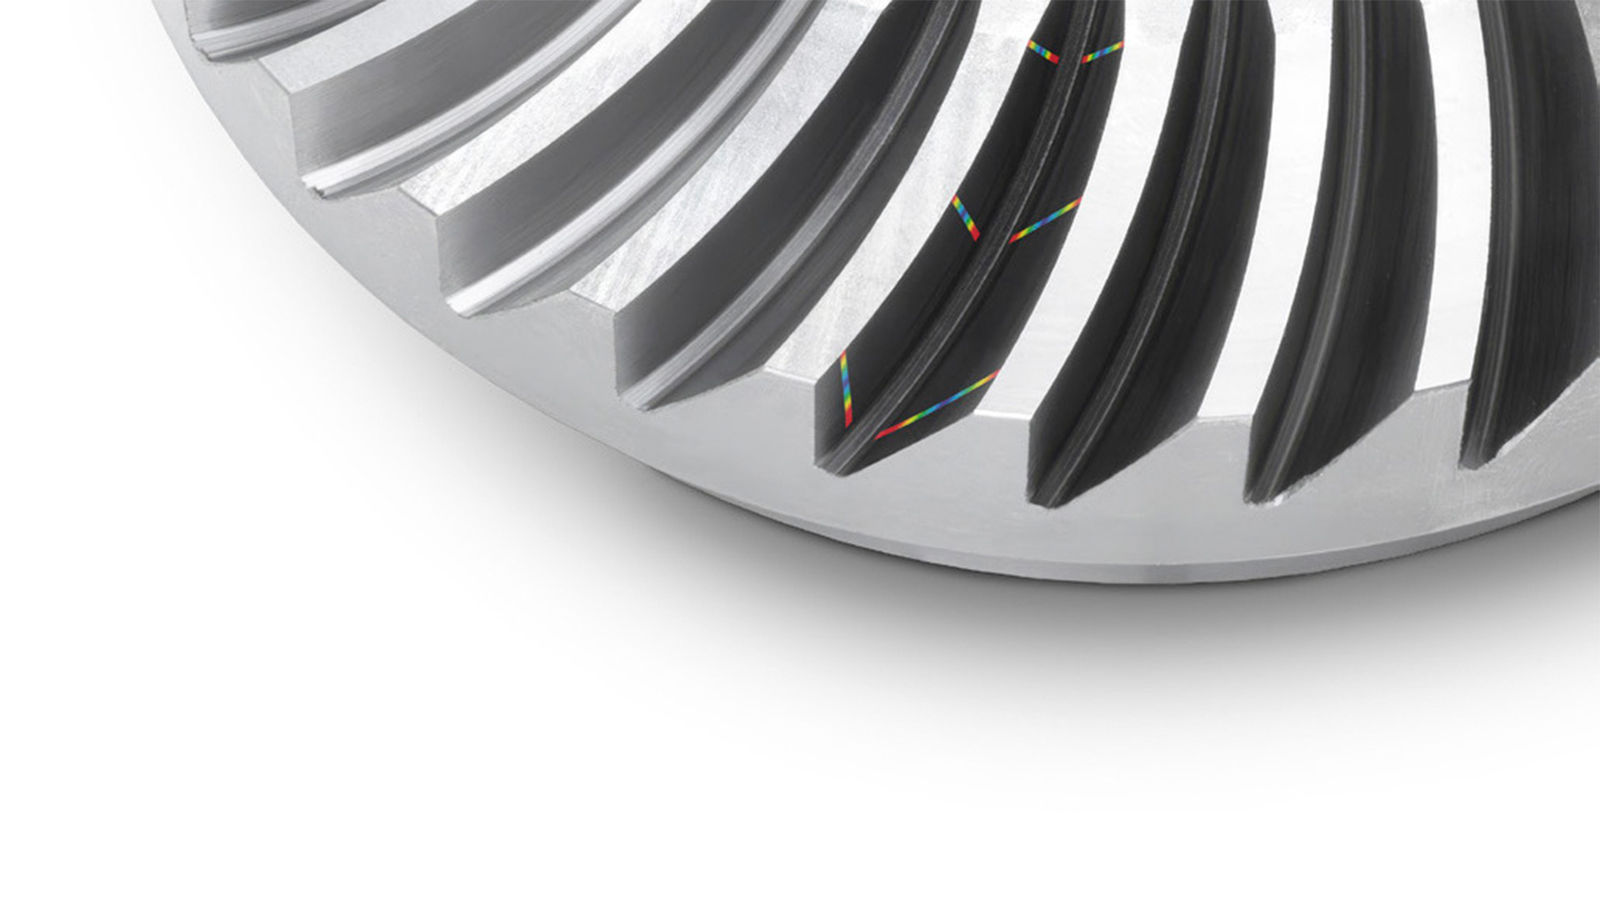
In addition to throughput limitations, conventional surface roughness measurement systems involve higher hardware costs. The extremely fine stylus tips required for high-resolution roughness evaluation are considerably more expensive and inherently fragile. These probes are highly susceptible to damage if not handled carefully (see Figure 2), leading to increased maintenance requirements and potential downtime. Furthermore, such systems rely on dedicated electronics optimized for high-frequency signal acquisition, adding complexity to the measurement setup.

Figure 2—Skidless surface finish probe.
Share and save:


This article appeared in the July 2026 issue.


Read PDF

[advertisement]

In contrast, waviness evaluation does not require the same level of resolution or specialized hardware. By leveraging industry-standard spherical probe tips—commonly used for form measurement—it is possible to accurately capture waviness characteristics without the need for dedicated surface roughness instrumentation. This approach significantly reduces system cost and complexity while enabling longer scan lengths and faster measurement cycles. As a result, waviness analysis using spherical probes provides a practical and efficient solution for identifying surface-related deviations that influence noise, efficiency, and durability in bevel gears.

Surface Roughness Measurement

Surface roughness measurements are typically performed using skidless probes to preserve long-wavelength surface information (see Figure 3). Automatic stylus orientation is employed to maintain perpendicular contact with the tooth flank throughout the scan, ensuring accurate data acquisition across the profile. In contrast, skidded probes are not suitable for waviness extraction, as the skid mechanically filters out longer wavelength deviations. However, skidded probes do offer certain practical advantages—such as robustness and ease of implementation—and are therefore utilized in some large-scale gear inspection systems, including those developed by Gleason.

Figure 3—Skidless versus skidded probe.

Given these limitations, dedicated waviness evaluation methods provide a more reliable and consistent solution. By avoiding the constraints of skidded probe designs and eliminating the need for high-resolution roughness instrumentation, waviness-focused measurement approaches—particularly those based on spherical probe tips—enable efficient, repeatable characterization of surface deviations that are critical to gear performance.

Bevel Gear Waviness Analysis

Recent developments by Gleason Metrology Systems enable waviness testing using a standard spherical ruby stylus without the need for dedicated surface roughness hardware (typically 1–2 mm tip diameter). For cutoff wavelengths above 0.8 mm, a reduced sampling density is sufficient, allowing for significantly faster scans and reduced measurement cycle times.

Measurements are performed along the pressure angle direction, which is particularly well suited for detecting the predominant waviness patterns on the tooth flank. This orientation aligns with the typical surface lay produced by common bevel gear manufacturing processes, improving the sensitivity and relevance of the measurement results.

Advanced mathematical spline fitting algorithms are employed to effectively increase the nominal XYZ point density of the measured surface. This enables high-resolution waviness characterization while utilizing the standard 9×5 flank form measurement grid typically generated by bevel gear design software.

The required increase in data density for waviness evaluation is achieved dynamically during the measurement cycle, while preserving the original flank form results that are transmitted to machine correction software. This approach eliminates the need to create separate part programs with finer flank form grids solely for waviness analysis. Furthermore, it allows waviness evaluation to be seamlessly integrated into the standard inspection process without impacting existing correction workflows or requiring additional measurement passes.

Figure 4—Illustrates waviness along the tooth depth.

Software Implementation and Programming

Waviness analysis is fully integrated into the GAMA software environment, providing a flexible and user-friendly interface for evaluation. Operators can select individual or multiple grid columns, apply averaging functions, define independent tolerance limits for drive and coast flanks, and choose from multiple filtering strategies, including Gaussian and form-following methods, to tailor the analysis to specific application requirements.

All bevel gear measurements—including index, flank form, tip and root depth, and waviness—are completed within a single automated measurement cycle without the need for operator intervention. This integrated approach ensures consistent results, reduces inspection time, and minimizes the potential for user-induced variability, while supporting efficient and comprehensive gear quality assessment.

Figure 5—Shows an example of waviness programming within the GAMA interface.

Advanced Waviness Charting

New charting functionality enables the visualization of multiple waviness traces for each tooth and flank, supporting rapid identification of systematic and localized deviations. Key waviness parameters—Wa (arithmetic mean waviness), Wc (maximum peak-to-valley height), and Wt (total waviness height)—are calculated for each trace and automatically compared against user-defined tolerance limits.

[advertisement]

This enhanced visualization and evaluation capability allows operators and engineers to quickly interpret surface behavior, identify recurring patterns, and take targeted corrective actions, further improving process control and gear quality.

Figure 6—Presents an example waviness chart.

Enhanced Bevel Gear Charting

A new portrait-style gear chart consolidates deviation data, surface quality metrics, and key geometric characteristics into a single comprehensive report, enabling more efficient analysis and interpretation (see Figure 8).

In addition, a new bevel flank Form analysis has been developed to evaluate form deviations on a per-column basis along the flank form grid. This analysis incorporates the removal of longer-wavelength form elements—such as crowning (see Figure 7)—through second-order polynomial fitting. By filtering out these intentional macrogeometry features, the resulting form-deviation data more accurately represents localized surface variations critical to gear performance.

GAMA further enhances this functionality by allowing independent tolerance definitions for form deviations at each measurement column, organized across five distinct regions from heel to toe. This capability supports the application of region-specific tolerances along the spiral angle, accommodating intentional surface modifications—such as ENDREM—while maintaining precise control over critical areas of the tooth flank.

Figure 7—Form deviation analysis at each column of flank form measurements.
Figure 8—Bevel portrait chart.

Bevel Gear Root Scanning

Root scanning capability enables the measurement of multiple critical features—including flank geometry, tooth spacing, top land, root depth and angles, as well as detailed root geometry—within a single automated inspection cycle. Root measurements are evaluated relative to theoretical design coordinates, ensuring accurate comparison to nominal values.

Nominal root data is stored in dedicated root definition files, allowing both standard flank form measurements and root scan evaluations to be performed within the same measurement cycle. This integrated approach improves measurement efficiency, maintains consistency between datasets, and supports comprehensive analysis without the need for separate setups or additional inspection steps.

Figure 9—Flank and root fillet scan using nominal points from design software.
Figure 10—Root fillet scanning selectable locations along the face width.

Conclusion

Increasing performance demands in bevel gear applications—driven by higher torque density, stricter acoustic requirements, and extended durability expectations—necessitate more advanced and comprehensive inspection methodologies. Traditional flank form evaluation alone is no longer sufficient to fully characterize the surface-related deviations that directly influence gear performance.

The advancements presented in this work demonstrate a significant evolution in bevel gear measurement capabilities. By enabling accurate waviness analysis using standard spherical probe tips, the need for specialized surface roughness hardware is eliminated, reducing system cost, complexity, and sensitivity to probe damage. At the same time, dynamic data density enhancement and advanced spline-based processing allow high-resolution surface characterization without compromising measurement speed or requiring modified inspection programs.

Integration within the GAMA software environment further enhances usability and efficiency, allowing flexible parameter selection, advanced filtering strategies, and fully automated multi-parameter inspection within a single measurement cycle. New visualization tools—including multi-trace waviness charting and portrait-style gear reports—provide improved diagnostic capability, enabling rapid identification of systematic deviations and facilitating targeted process corrections.

Additional innovations such as per-column flank form analysis, region-specific tolerance control, and integrated root scanning expand the scope of measurement beyond traditional limits, delivering a more complete representation of gear geometry and surface condition. The ability to evaluate these characteristics relative to theoretical design data within a unified workflow ensures consistency and traceability across all measurement results.

Together, these technologies provide a powerful and efficient solution for modern bevel gear quality control. By combining faster measurement cycles, reduced hardware requirements, and enhanced analytical capability, they enable manufacturers to achieve higher product quality, improved noise and efficiency performance, and more robust process control in increasingly demanding applications.

gleason.com

[advertisement]