[advertisement]
Technical Articles

October 23, 2026


Dr. Andrew Wild


Simon Terry


Dr. Paul Langlois


Jaekwon Lee


Shinya Sudo


Design Mesh NVH Optimization Automotive Technical

Efficient Machine Learning Optimization of Gear Microgeometry and Comparison With Manually Designed Gears

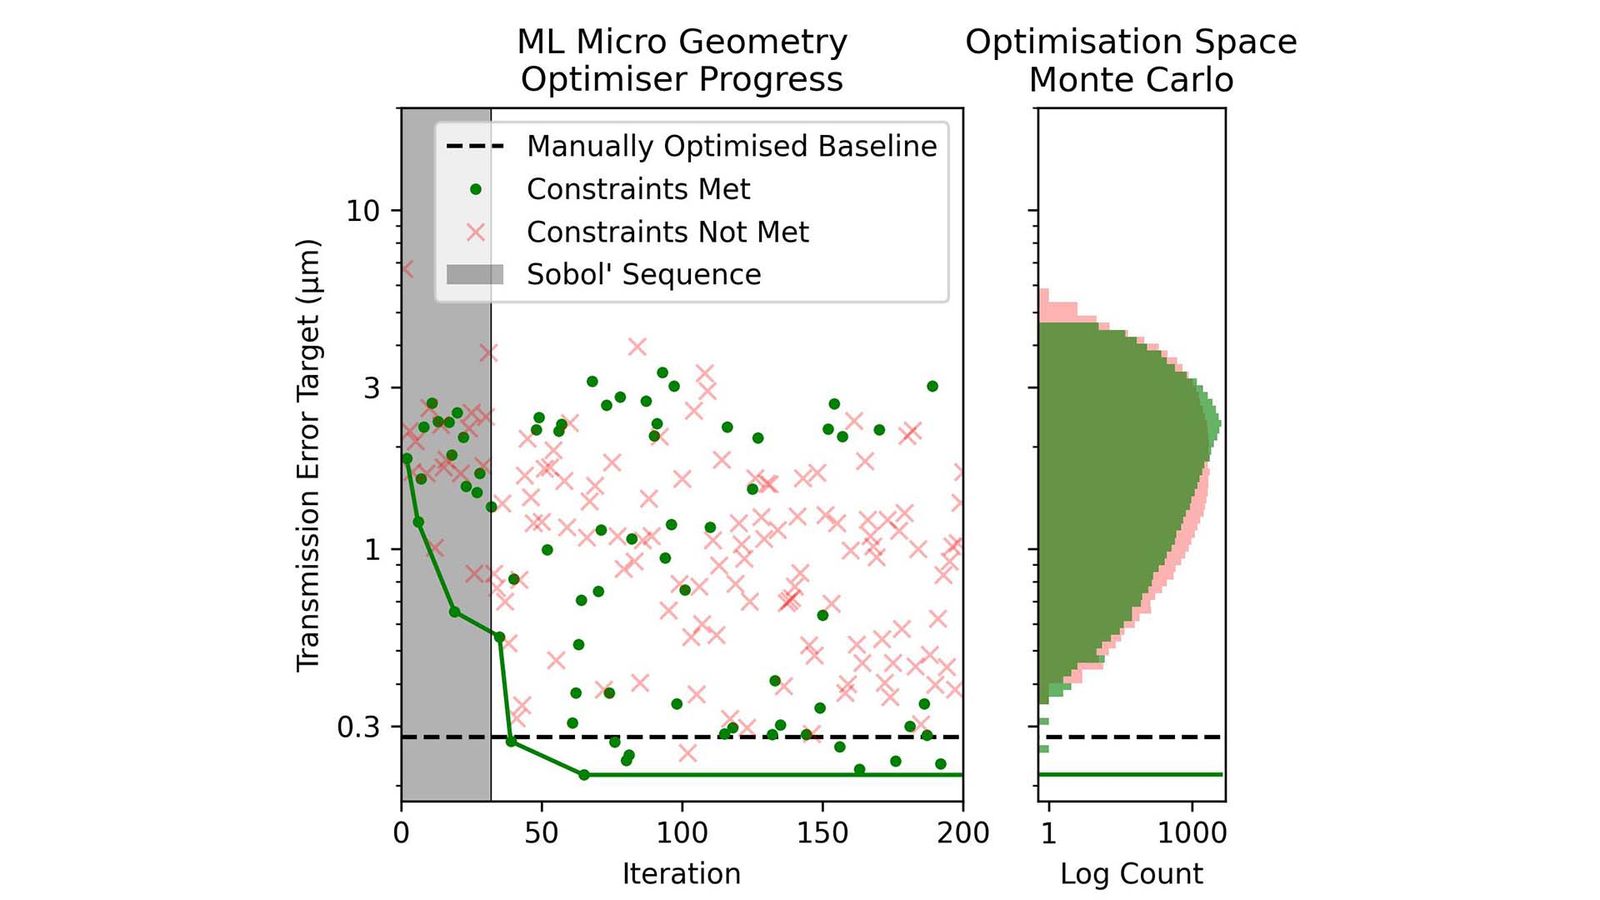
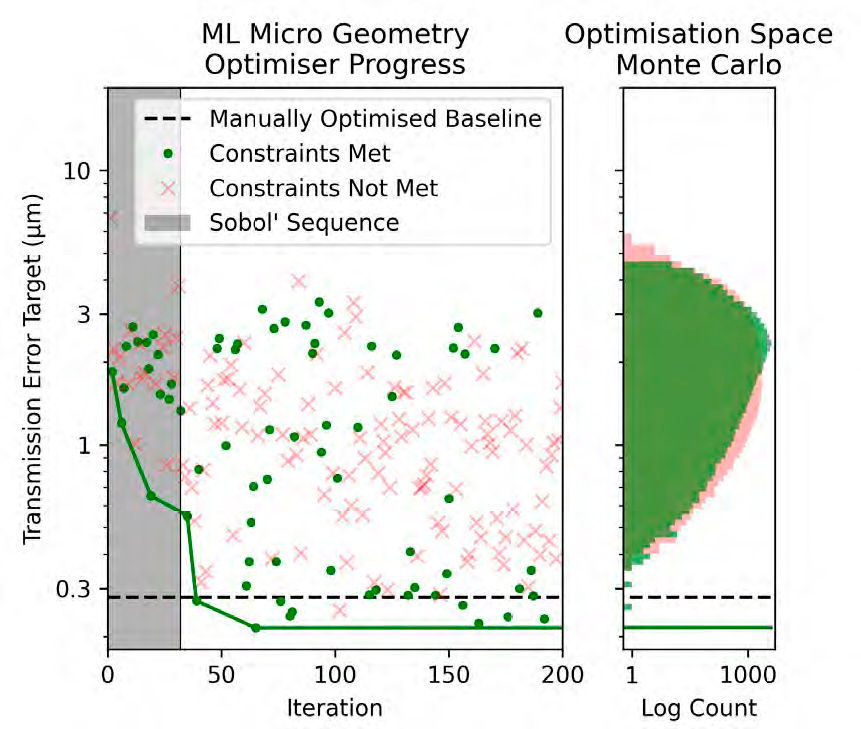
Figure 1—Machine learning microgeometry optimizer (left) compared with a 100,000-sample Monte Carlo experiment over the optimization space (right). In both plots, the main text defines the transmission error target as the root-mean-square of the weighted sum of TE across both gear meshes.

The automotive industry is experiencing a paradigm shift in its move away from internal combustion engines (ICE) toward electric vehicles (EVs). The high speeds of electric motors, combined with a lack of ICE masking noise, demand that powertrains be optimized for noise, vibration and harshness (NVH) to prevent undesirable phenomena such as gear whine, a high-frequency tonal noise generated between two meshed gears. Alongside ever-increasing demands on vehicle performance and the need to minimize cost and development time, gear whine must be considered alongside a multitude of other factors, including gearbox performance, efficiency and durability.

Whilst there exists a variety of techniques an engineer could use to improve gear whine, one particularly effective method is to reduce the transmission error (TE) excitation, i.e., the variation in relative displacement between two meshed gears as they rotate. Optimizing an excitation source such as TE has the benefit of improving NVH over a range of operating conditions and can be quantified independently of the downstream dynamics of the system through a resource-efficient static loaded tooth contact analysis (LTCA). Often the most effective way to reduce TE is by varying the microgeometric relief applied to the loaded flanks of gear teeth (Ref. 1).

Optimizing gear microgeometry can provide an effective route to reduce TE whilst minimizing redesigning the wider gearbox; however, its optimization can be difficult to automate. The microgeometry of a gear tooth is a two-dimensional surface typically defined through a set of scalar parameters encoding a variety of linear and quadratic modifications along the lead and profile directions. The relationship between these microgeometry parameters and LTCA results, such as TE, is not necessarily convex, meaning that whilst gradient descent (Ref. 2) or derivative-free simplex methods such as Nelder-Mead (Ref. 3) are effective, they can get stuck in local optima. Another approach to select gear geometry uses search strategies such as Design of Experiments (Refs. 4–6); however, these methods become infeasible for high-dimensional optimization problems.

In the literature, gear microgeometry optimization is at times considered alongside gear macrogeometry optimization (specifying tooth numbers, helix angle, etc.) subject to other metrics such as gear ratios or durability considerations. The nonlinear and high-dimensional nature of gear optimization has led to the wide adoption of evolutionary and pattern-based algorithms for gear optimization. Evolutionary strategies such as the genetic algorithm (Refs. 7–16) or particle swarm (Refs. 17–19) are underpinned by natural phenomena such as genetic mutations and swarm intelligence to identify a Pareto optimal set of solutions (often optimizing several metrics of gear NVH, durability and efficiency). For example, Bonori et al. (Ref. 8) varied tip and root relief of two meshed spur gears using a genetic algorithm, achieving up to an 85 percent reduction in peak-to-peak TE as calculated via a static nonlinear finite element method calculation. Alternatives to metaheuristic algorithms include the pattern-based Dividing Rectangles method, which was successfully employed by Artoni et al. in the optimization of face-hobbed hypoid (Ref. 20) and cylindrical (Ref. 21) gears to minimize TE subject to contact patch considerations.

Whilst metaheuristic and pattern-based algorithms offer a reliable tool for optimizing nonlinear functions with many local minima, the run time of these algorithms can be prohibitive. To ensure that these algorithms converge often requires more than 104 function evaluations, making them time-consuming for high-fidelity analyses with individual runtime on the order of seconds. Furthermore, microgeometry optimization can be considered as a suboptimization routine that falls within (or alongside) macrogeometry and wider gearbox optimization. This has inspired efforts to reduce the computational complexity of metaheuristics; e.g., Qiu et al. (Ref. 22) optimized the microgeometry of a herringbone gear to minimize TE, meshing impact excitation, and vibration acceleration using a more efficient fitness-predicted genetic algorithm. This algorithm limits computational complexity by only running analyses in previously unseen areas of the optimization space, which in this case resulted in a modest 67 percent reduction in runtime when compared to a standard genetic algorithm.

Share and save:


This article appeared in the September/October 2026 issue.


Read PDF

[advertisement]

The need for increasingly efficient microgeometry selection has led to a recent trend in the gear optimization literature: the use of machine-learnt models as computationally efficient surrogates or emulators for expensive finite element analyses, thus enabling otherwise costly optimization techniques. Some examples of surrogate models within gear optimization literature include polynomial functions (Refs. 23, 24), neural networks (Refs. 25, 26), Gaussian processes conditioned on past analysis results (Ref. 27), and many others (Refs. 28–30). For example, Korta & Mundo (Ref. 28) trained a variety of surrogate models to predict TE, contact stress, and bending safety factors for spur gears with varying tooth profile modifications using a dataset of 38 finite element analyses. These computationally efficient surrogates were then used to identify optimal spur gear profile modifications using a genetic algorithm with up to 50,000 surrogate function evaluations. In another example, Tang et al. (Ref. 25) used 200 past analysis results to train a neural network that emulated NVH results and used it to optimize six gear parameters with a genetic algorithm. Lastly, Heafner et al. (Ref. 26) used a neural network to efficiently predict tooth root stress and thus the life of microgears; a typically lengthy analysis requiring finite element techniques to capture large deflection effects.

Whilst machine-learnt surrogate models permit the use of otherwise costly search algorithms, ensuring model accuracy and selecting appropriate optimization techniques for gear microgeometry optimization requires both machine learning (ML) and engineering domain knowledge. For this reason, we explore the utility of optimization guided by ML surrogate models for microgeometry optimization. Directed by user-defined LTCA targets and constraints, the optimization technique uses surrogate models to efficiently explore the whole problem space, only performing analyses for microgeometries that are either likely to improve on previous results or explore a previously unseen region of the problem space. The optimization technique can be used to identify microgeometries for cylindrical gearsets with multiple meshes, including planetaries, conducting bespoke workflows minimizing a target function and any number of constraints spanning multiple operating conditions.

To demonstrate the ML microgeometry optimization technique, the authors recreate a past optimization study. The focus of this paper will be the optimization of a gear set in which an idler gear is driven by two input gears; the gear set will be optimized for NVH and durability across both meshes using Advanced-LTCA, a hybrid Hertzian and FE-based loaded tooth contact analysis (Ref. 31). In the section “Optimization of a Gear Set,” the ML optimization technique is used to validate and improve upon the manually optimized microgeometry, demonstrating that it is possible to identify similar optimized microgeometries to an engineer within a drastically reduced timeframe. Moving beyond the original optimization scope, in the section “Optimization with Common Input Gears,” we perform the same optimization whilst ensuring the same microgeometry is applied to the two input gears, revealing what performance can be achieved with reduced manufacturing costs. Lastly, in the section “Optimization for Torque Robustness,” we explore how we can optimize over different operating conditions to obtain a torque-robust microgeometry. It is emphasized that the variety of optimizations undertaken in this paper are made possible by the highly efficient nature of the microgeometry optimization technique. Whilst traditional optimization requires manual input from an engineer, the ML microgeometry optimization technique runs in approximately 30 minutes and frees up an engineer’s time, allowing them to focus on what performance metrics they want from a microgeometry rather than how to find it. The presented method is implemented in SMT’s MASTA software.

Optimization of a Gear Set

To compare the ML microgeometry optimization technique to an engineer, we begin by recreating the optimization scope used within the original manual process. Each of the three gears (idler and the two input gears) can have distinct microgeometries with their own lead slope, lead crowning, profile slope, profile barreling and tip relief. The idler gear meshes with the two input gears labelled left (L) and right (R), with the optimization targeting improved NVH and durability across both meshes under 90 Nm of torque. The optimization of gear microgeometry at a single torque is chosen to match the scope and allow comparison with the original manual optimization; consideration of multiple operating conditions will be explored in later sections.

Optimization Setup

One common task within microgeometry optimization is the mitigation of misalignment, in which imperfect shaft and gear alignment leads to uneven contact across the tooth’s face width (lead direction). Considering that the misalignment will be different across the two gear meshes, we choose to independently optimize the lead slope at each mesh, allowing the optimization technique to effectively reduce misalignment. The lead slope on a given mesh depends linearly on the lead slope of the two meshed gears; as the idler meshes with both input gears, its lead slope can be fixed without limiting the scope of the optimization technique. To independently reduce stress concentrations at the tips of all gears, tip relief is allowed to take different values on each gear. All remaining microgeometry parameters, e.g., lead crowning, profile slope and profile barreling, are only varied on the idler to reduce the dimensionality of the problem space (see Table 1).

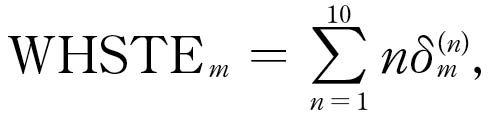
In this initial optimization, we optimize the gear set for a single torque, targeting improved NVH whilst ensuring durability by retaining good stress distributions across the faces of the gear teeth. Whilst the primary goal of the optimization is the reduction of the first harmonic of TE at each mesh, it is important that the first harmonic not be optimized at the expense of higher harmonics. For this reason, the weighted harmonic sum of transmission error (WHSTE) will be minimized across both meshes:

(1)

where dm(n) is the nth TE harmonic for gear mesh m which can take one of two values, L or R. The optimization technique will minimise the root sum of squares of the WHSTE across both meshes: . To ensure that stress is well-distributed over each mesh, we use edge load factors:

(2)

where vm,e is the stress on mesh m along edge e (top, bottom, left, or right) and vm,!e is the stress everywhere other than that edge. To ensure the optimization technique returns durable microgeometries, we constrain left and right edge load factors to be below 75 percent and top and bottom edge load factors to be under 50 percent.

Figure 1—Machine learning microgeometry optimizer (left) compared with a 100,000-sample Monte Carlo experiment over the optimization space (right). In both plots, the main text defines the transmission error target as the root-mean-square of the weighted sum of TE across both gear meshes.

Optimization Performance

[advertisement]

The optimization begins by training an ML surrogate model on a set of initial samples, which is typically set to a power of two to set up a low-discrepancy Sobol’ sequence to achieve good coverage over the high-dimensional input space. After the initial surrogate model has been fit to the data, this surrogate model is used to select a new microgeometry for analysis that is likely to meet the constraints, achieve a better target, or explore unseen regions of the problem space. For the optimization of eight microgeometry parameters, we use 32 initial samples followed by 168 optimization technique steps for a total of 200 LTCA analyses (see Figure 1), taking between 15 and 20 minutes on a desktop with an Intel Core i9-14900K with 128GB of RAM.

Microgeometry Parameter

Gear

Manually Optimized

Machine Learning Optimized (Scope)

Lead Crowning

Idler

2 µm

2 µm (2 µm–20 µm)

Profile Slope

Idler

0 µm

-1µm (-30 µm–30 µm)

Profile Barreling

Idler

2 µm

2 µm (2 µm–20 µm)

Tip Relief

Idler

7 µm

10 µm (0 µm–10 µm)

Lead Slope

Left

9 µm

21 µm (-30 µm–30 µm)

Tip Relief

Left

7um

4 µm (0 µm–10µm)

Lead Slope

Right

-9 µm

-9 µm (-30 µm–30 µm)

Tip Relief

Right

7 µm

10 µm (0 µm–10 µm)

Table 1—Microgeometry parameters before and after optimization. The scope of microgeometry parameters considered by the optimizer is given in brackets.

The lowest target found was 0.22 µm, which is lower than the manually optimized baseline microgeometry, which had a target value of 0.28 µm. To demonstrate the effectiveness of the optimization technique, we compare this to a 100,000-sample Monte Carlo simulation using uniform bounds over the optimization space, which took roughly three days to complete across two high-performance desktops. In Figure 1, it can be seen that the lowest target value found within the Monte Carlo study was 0.26 µm, with the 0.1 percentile of microgeometries that met constraints taking the value 0.52 µm. The ML optimization technique found 23 microgeometries that met the constraints with a target value less than this target value, demonstrating that the optimization technique is capable of finding many one-in-a-thousand microgeometries in a matter of minutes. By only performing LTCA analyses that are likely to either yield an improved solution or rule out less-explored regions of the problem space, the ML microgeometry optimization technique is highly data efficient and can thus achieve optimization in a significantly reduced timeframe.

Results and Comparison to Baseline

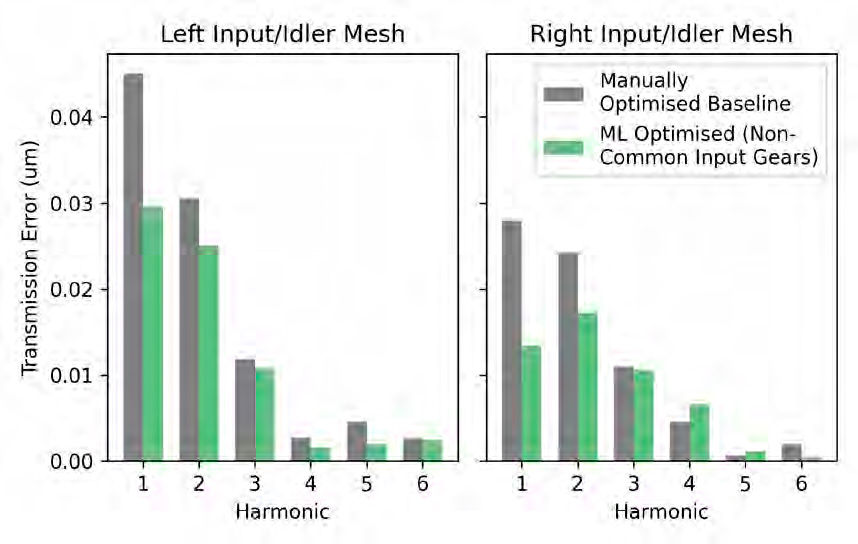
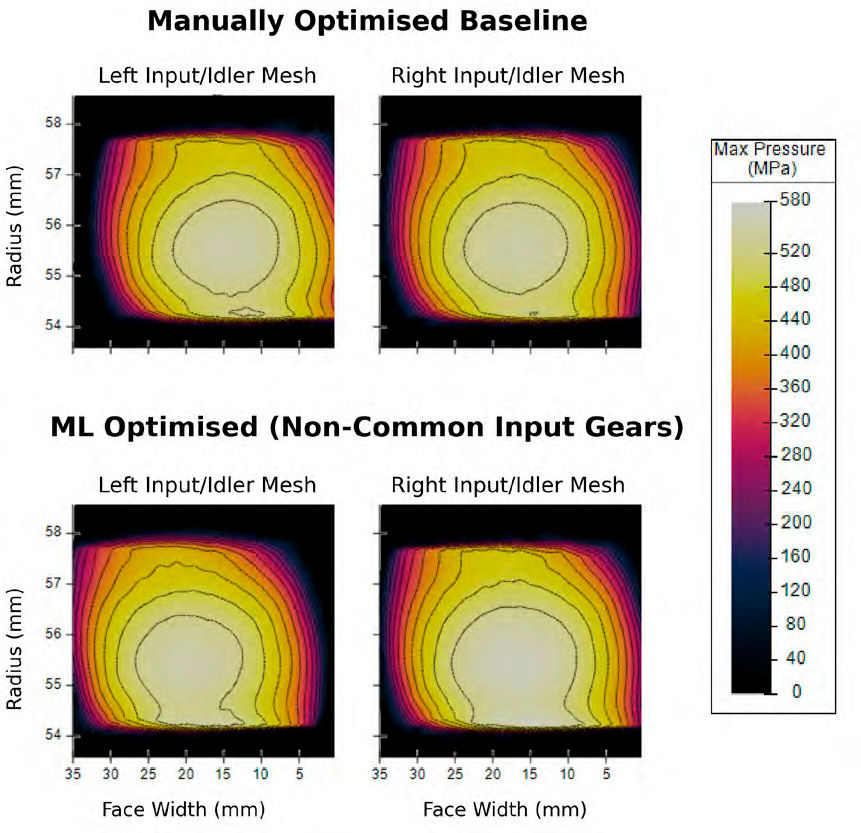
The optimization technique found a range of promising microgeometries; each one is then manually checked by an engineer who selects for a combination of: a low WHSTE across both meshes, a preferentially low first harmonic of TE across both meshes, and a good contact patch across both meshes. Manually looking through the lowest results found by the optimization technique revealed iteration 163 to be a good trade-off between these targets. These microgeometry parameters were then rounded to the nearest micrometer and re-evaluated against the baseline microgeometry. The optimized microgeometry has a broadly improved set of TE harmonics (see Figure 2) and displays a similar contact patch to the baseline design with better centralization on the left input gear to idler mesh (see Figure 3). This can be reflected by comparing the optimized microgeometry parameters in Table 1; the manually and automatically optimized microgeometries have many features in common, such as the parabolic reliefs (lead crowning and profile barreling) taking their minimum values of two. The main difference between the two microgeometries is the increased lead slope on the left input gear from 9 µm to 21 µm, in which the ML optimization decreased the edge stress, thereby achieving a slightly more centralized contact patch (see Figure 3) whilst also resulting in improved TE. The similarity between the manual and ML-optimized microgeometries emphasizes that the original microgeometry was already very successfully manually optimized; putting the small performance improvements aside, the main benefit of the ML optimization technique was the drastically reduced run time totaling about 20 minutes.


Figure 2—TE harmonics for each gear mesh before and after optimization.
Figure 3—Contact patches for each gear mesh before and after optimization.


Figure 3—Contact patches for each gear mesh before and after optimization.
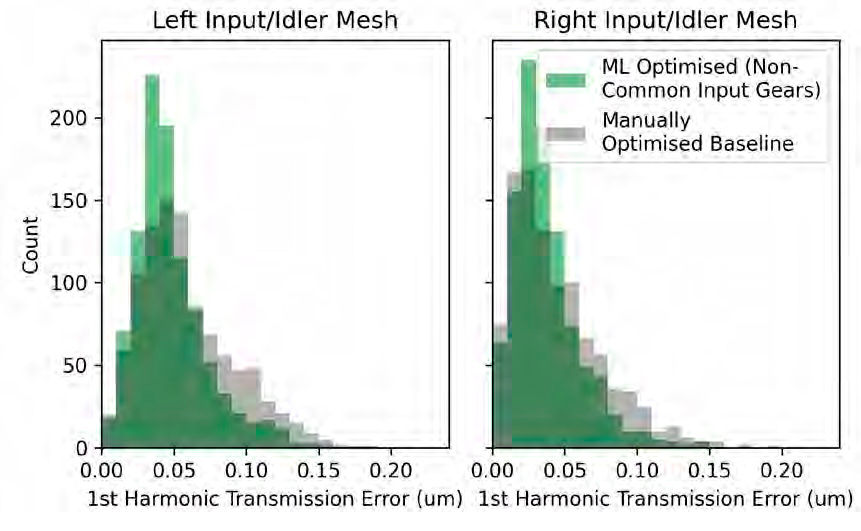
Figure 4—Robustness of the first harmonic of TE for the manually and ML-optimized microgeometry.


Robustness to Manufacturing Deviations

So far, we have compared the baseline and ML-optimized microgeometries assuming that each parameter is known exactly; we refer to these as the nominal microgeometries. To simulate manufacturing deviations, we apply independent Gaussian tolerances to each microgeometry parameter, with lead slope, lead crowning and profile barreling having a standard deviation of 0.6 µm and profile slope and tip relief having a standard deviation of 0.9 µm. The robustness is evaluated by a Monte Carlo simulation requiring 1,000 samples per microgeometry, taking approximately one and a half hours using the previously mentioned hardware. It should be noted that these definitions of microgeometry tolerances were chosen to match the original manual optimization study; however, manufacturing deviations arising from any specific gear manufacturing process can be chosen. After optimization of the nominal microgeometry, we check the robustness. If the robustness is not satisfactory, the user can select a different solution from the optimization to check again for robustness. In Figure 4, we compare the robustness of the manually optimized baseline and optimized microgeometry, observing an improved average first harmonic of TE across both gear pair meshes.

By optimizing the nominal microgeometry, we have also indirectly optimized for a low average TE across both meshes when considering manufacturing tolerances. It should be expected that finding robust microgeometries through optimization of the nominal becomes less effective as the manufacturing tolerances are increased. Given that a typical robustness study requires on the order of 103 function evaluations, optimization thereafter is likely to take over 105 function evaluations (assuming an outer optimization loop requiring one hundred iterations). As demonstrated in this paper, efficient optimization of nominal microgeometry allows engineers to find high-performing candidates in a reduced timeframe; these microgeometries can then be checked for robustness as a post-processing step. The authors are conducting further research into microgeometry optimization techniques that directly consider robustness; however, it is emphasized that optimization of the nominal will remain a practical first step before further robust optimization.

Optimization With Common Input Gears

The previous optimization study closely followed the original optimization procedure by allowing the microgeometry on the two input gears to differ; this decision maximizes the optimization potential but does so with an increased cost associated with manufacturing two distinct sets of input gears. Using the microgeometry optimization technique, we will now explore the optimal performance that can be achieved using common input gears. We now vary most microgeometry parameters on the common input gears, varying only the tip relief on the idler (see Tables 2 and 3), with optimization targets, constraints, and load case unchanged from the initial optimization. The optimization was run for two different ranges of tip relief parameters; for each optimization run, a single solution that balanced TE and contact patch quality was selected by an engineer.

Microgeometry Parameter

Gear

Machine Learning Optimized Common Input 1 (Scope)

Lead Slope

Left/Right

9 µm (-30 µm–30 µm)

Lead Crowning

Left/Right

2 µm (2 µm–20 µm)

Profile Slope

Left/Right

1 µm (-30 µm–30 µm)

Profile Barreling

Left/Right

2 µm (2 µm–20 µm)

Tip Relief

Left/Right

0 µm (0 µm–10 µm)

Tip Relief

Idler

9 µm (0 µm–10 µm)

Table 2—Microgeometry parameters for the first common input gear optimization, with tip relief limited to 0 µm–10 µm. The scope of microgeometry parameters considered by the optimizer is given in brackets.

Microgeometry Parameter

Gear

Machine Learning Optimized Common Input 2 (Scope)

Lead Slope

Left/Right

12 µm (same as Table 2)

Lead Crowning

Left/Right

3 µm (same as Table 2)

Profile Slope

Left/Right

2 µm (same as Table 2)

Profile Barreling

Left/Right

0 µm (same as Table 2)

Tip Relief

Left/Right

0 µm (0 µm–20 µm)

Tip Relief

Idler

20 µm (0 µm–20 µm)

Table 3—Microgeometry parameters for the second common input gear optimization, with the tip relief scope extended to 0 µm–20 µm. All other parameter scopes are unchanged from Table 2.

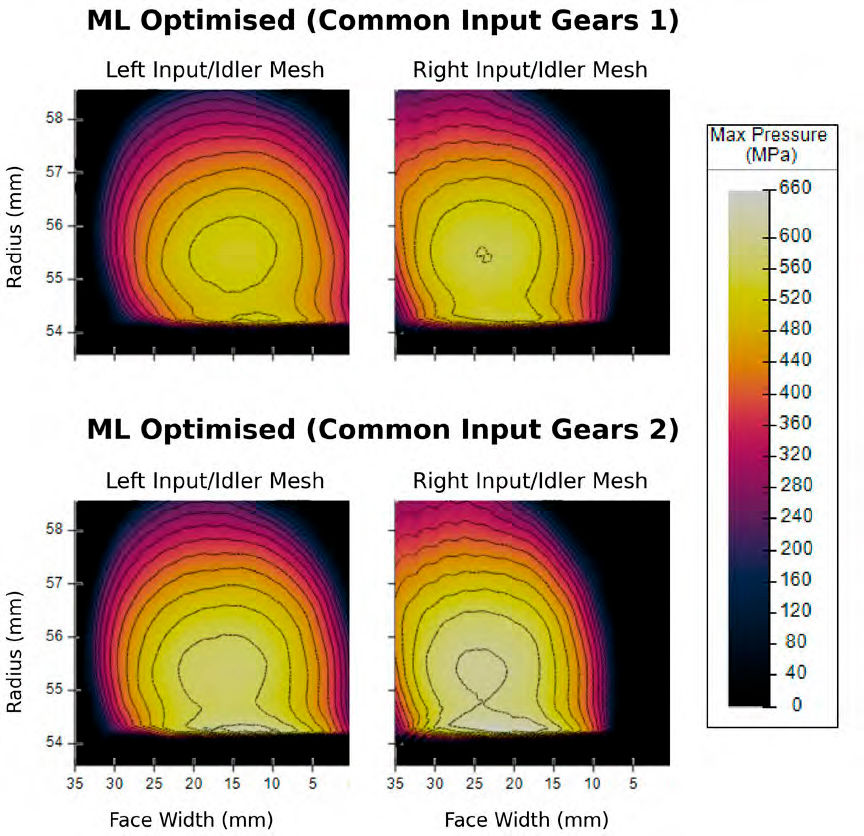
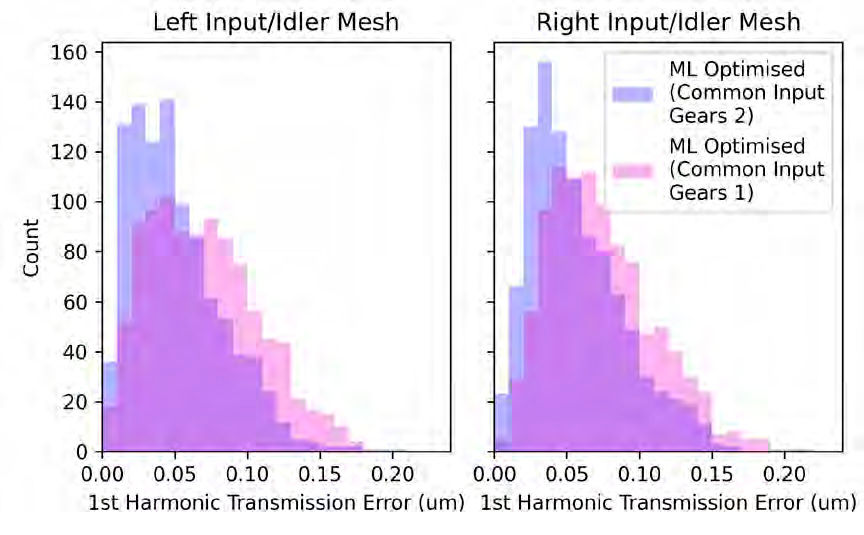
For each optimization, a total of 150 iterations (16 initial samples and 134 optimization technique steps) were performed, resulting in a combined runtime of approximately 30 minutes. One solution from each run was selected, and the microgeometry parameters were rounded to the nearest micrometer. Perhaps the most noticeable difference between the two common input gear solutions and the previous noncommon input gear microgeometries is the stress distribution; it is noted that the first of the two common input gear optimization results has smaller stress concentrations (see Figure 5) but at the cost of higher TE. The root sum of squares WHSTE across both meshes takes values of 0.32 µm and 0.34 µm for the two microgeometries; these values are higher than the baseline (0.28 µm) and noncommon input gear optimization (0.22 µm), but still low when compared to the Monte Carlo study (0.1 percentile with value 0.52 µm). Furthermore, the difference in TE between noncommon and common gears reduces when comparing the average TE over tolerances instead of the nominal values (see Figure 6); it would be up to the engineer as to whether this is an appropriate increase in TE for the reduced manufacturing costs. As seen in this section, it is possible to use the optimization technique to find optimal microgeometries under different design constraints; using several runs of the microgeometry optimization technique, a Pareto set of optimal microgeometries can be found from which an engineer can select the most appropriate solution.

Figure 5—Contact patches for each gear mesh for two common input gear optimizations.
Figure 6—Robustness of the first harmonic of TE for the two optimized common input gear microgeometries.

Optimization for Torque Robustness

In previous sections, the ML microgeometry optimization technique has been used to reduce the WHSTE whilst considering durability through contact patch constraints across both meshes at a single torque of 90 Nm. After successfully optimizing considering a single torque, we now expand the optimization to improve NVH under multiple operating conditions. By reducing TE at other torques, we will search for a torque-robust microgeometry and compare it to the previously obtained optimized microgeometries.

To optimize NVH under multiple operating conditions, we now define the WHSTE as WHSTEm,x for each mesh m and torque x. The root-sum-of-squares target then combines the WHSTE across both meshes and multiple torques:

(3)

where T is a set of torques. Three torque-robust optimizations are considered:

  1. T={50 Nm,90 Nm,150 Nm},

  2. T={10 Nm,50 Nm,90 Nm,150 Nm},

  3. T={10 Nm,50 Nm,90 Nm,150 Nm,300 Nm}.

In all cases, the contact patch constraints remain unchanged from the previous optimizations, considering only a single torque of 90 Nm. Furthermore, we explore the same range of microgeometry parameters as seen in the noncommon input gear optimization as outlined in Table 1.

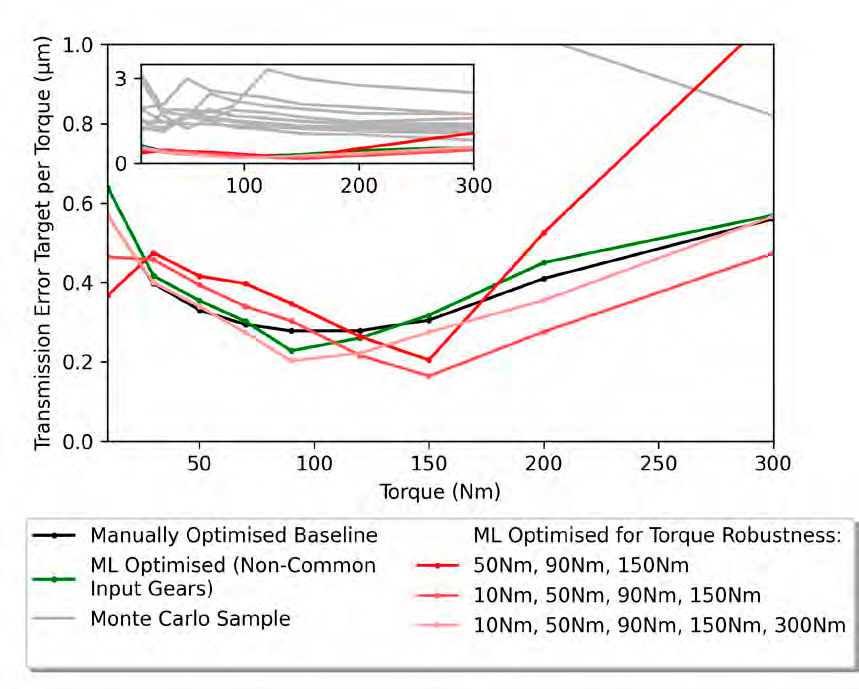
In Figure 7, the RMS of the WHSTE combined over both meshes for a given torque is plotted for a range of torques for each microgeometry. Torque-robust optimizations B and C have significantly improved NVH performance at very low torques (roughly less than 25 Nm) due to their active targeting of the 10 Nm load case. Furthermore, torque-robust optimization C has a clear reduction in TE at higher torques through its consideration of the 300 Nm load case. Interestingly, torque-robust optimization A, which targeted torques of 50 Nm, 90 Nm and 150 Nm, outperformed the noncommon input gear optimized solution at its individual target torque of 90Nm. In optimization, we cannot guarantee that the global minimum has been found, and two separate optimizations can have similar solutions if their objectives do not contradict. Whilst the torque-robust optimization A indeed found a better solution at 90 Nm than the noncommon input gear optimization, it is emphasized that both solutions are actually very similar; this can be seen by comparing them both against random samples from the Monte Carlo covering the optimization, as seen in the inset of Figure 7.

Figure 7—WHSTE (root sum of squares over both meshes) is plotted for a range of torques and microgeometries. Inset: The optimality of all solutions is highlighted by comparing to 10 microgeometries from a Monte Carlo study of the optimization space.

Conclusion

The optimization of gear microgeometry is a challenging process often carried out by experienced engineers who often balance competing optimization objectives against lengthy calculation times arising from high-fidelity loaded tooth contact analyses. In this work, we have seen how ML microgeometry optimization can be used to achieve efficient optimization of microgeometries, balancing noise, vibration and harshness with other metrics such as durability on a computational budget. By recreating a past manual microgeometry optimization study, we have validated that the optimization technique can yield similar performance to a gear specialist but doing so in a drastically reduced timeframe; providing this powerful tool to an engineer allows them to optimize for a variety of different objectives from which an ideal solution can be selected. Robustness of microgeometries identified by the optimization technique was quantified through computationally expensive Monte Carlo studies. Although the microgeometries identified in this study were robust, direct robust optimization that guarantees performance over manufacturing tolerances has been identified as an area for future research. It is emphasized that the efficient nature of the optimization technique allows it to identify high-performing microgeometries quickly, allowing engineers to identify a varied set of microgeometries for downstream robustness verification and allowing this process to be used as an inner optimization loop alongside gear macrogeometry or wider powertrain optimization.


References

  1. D. Miler and M. Hoić, “Optimisation of cylindrical gear pairs: A review,” Mechanism and Machine Theory, Vol. 156, pp. 104156, 2021, doi: 10.1016/j.mechmachtheory.2020.104156.

  2. D. Ghribi, J. Bruyère, P. Velex, M. Octrue, and M. Haddar, “A contribution to the design of robust profile modifications in spur and helical gears by combining analytical results and numerical simulations,” Journal of Mechanical Design, Vol. 134, pp. 061011, 2012, doi: 10.1115/1.4006740.

  3. M. Gabiccini, A. Bracci, and M. Guiggiani, “Robust optimization of the loaded contact pattern in hypoid gears with uncertain misalignments,” Journal of Mechanical Design, Vol. 132, pp. 041010, 2010, doi: 10.1115/1.4001485.

  4. Akash Pavan S., S. Periyasamy, Vikram Karthik S. S., and A. Gopalakrishnan, “Microgeometry Optimization of Spur Gear for Electric and Hybrid Vehicle Applications,” 2019 IEEE Transportation Electrification Conference (ITEC-India), pp. 1–5, Dec. 17–19, 2019, doi: 10.1109/ITEC-India48457.2019.ITECINDIA2019-155.

  5. C. Brecher, C. Löpenhaus, and J. Brimmers, “Function-oriented tolerancing of tooth flank modifications of beveloid gears,” Procedia CIRP, Vol. 43, pp. 124–129, 2016, doi: 10.1016/j.procir.2016.02.155.

  6. M. Trippe, A. Lemmer, C. Löpenhaus, and C. Brecher, “Optimizing the operational behavior of bevel gears using a tolerance field-based approach,” Gear Technology, pp. 68–73, Aug. 2019.

  7. S. Lahoti, P. Patil, and J. Wagner, “Gear whine noise reduction by transmission error and contact pattern optimization: Simulation and testing correlation,” SAE Technical Paper 2021-01-1103, 2021, doi: 10.4271/2021-01-1103.

  8. G. Bonori, M. Barbieri, and F. Pellicano, “Optimum profile modifications of spur gears by means of genetic algorithms,” Journal of Sound and Vibration, Vol. 313, pp. 603–616, 2008, doi: 10.1016/j.jsv.2007.12.013.

  9. K. Deb and S. Jain, “Multi-Speed Gearbox Design Using Multi-Objective Evolutionary Algorithms,” Journal of Mechanical Design, Vol. 125, pp. 609–619, 2003, doi: 10.1115/1.1596242.

  10. P. Garambois, J. Perret-Liaudet, and E. Rigaud, “NVH robust optimization of gear macro and microgeometries using an efficient tooth contact model,” Mechanism and Machine Theory, Vol. 117, pp. 78–95, 2017, doi: 10.1016/j.mechmachtheory.2017.07.008.

  11. D. J. Fonseca, S. Shishoo, T. C. Lim, and D. S. Chen, “A genetic algorithm approach to minimize transmission error of automotive spur gear sets,” Applied Artificial Intelligence, Vol. 19, pp. 153–179, 2005, doi: 10.1080/08839510590901903.

  12. B. Blanco, J. L. Escalona, R. Lambert, R. Ling, and O. Balling, “On the definition and effect of optimum gear microgeometry modifications for the gearbox of an offshore 10-MW wind turbine,” Wind Energy, Vol. 26, pp. 717–740, 2023, doi: 10.1002/we.2825.

  13. V. V. Simon, “Multi-objective optimization of hypoid gears to improve operating characteristics,” Mechanism and Machine Theory, Vol. 146, pp. 103727, 2020, doi: 10.1016/j.mechmachtheory.2019.103727.

  14. E. Ben Younes, C. Changenet, J. Bruyère, E. Rigaud, and J. Perret-Liaudet, “Multi-objective optimization of gear unit design to improve efficiency and transmission error,” Mechanism and Machine Theory, Vol. 167, pp. 104499, 2022, doi: 10.1016/j.mechmachtheory.2021.104499.

  15. V.-T. Dinh, H.-D. Tran, T.-D. Bui, D.-B. Vu, D. Vu, N.-P. Vu, and T.-T.-H. Truong, “Multi-Objective Optimization of a Two-Stage Helical Gearbox with Second Stage Double Gear-Sets Using TOPSIS Method,” Processes, Vol. 12, pp. 1160, 2024, doi: 10.3390/pr12061160.

  16. C. Choi, H. Ahn, Y.-J. Park, G.-H. Lee, and S.-C. Kim, “Influence of gear tooth addendum and dedendum on the helical gear optimization considering mass, efficiency, and transmission error,” Mechanism and Machine Theory, Vol. 166, pp. 104476, 2021, doi: 10.1016/j.mechmachtheory.2021.104476.

  17. Y. Lei, L. Hou, Y. Fu, J. Hu, and W. Chen, “Research on vibration and noise reduction of electric bus gearbox based on multi-objective optimization,” Applied Acoustics, Vol. 158, pp. 107037, 2020, doi: 10.1016/j.apacoust.2019.107037.

  18. K. Tamboli, S. Patel, P. M. George, and R. Sanghvi, “Optimal Design of a Heavy Duty Helical Gear Pair Using Particle Swarm Optimization Technique,” Procedia Technology, Vol. 14, pp. 513–519, 2014, doi: 10.1016/j.protcy.2014.08.065.

  19. M. Sedak and B. Rosić, “Multi-Objective Optimization of Planetary Gearbox with Adaptive Hybrid Particle Swarm Differential Evolution Algorithm,” Applied Sciences, Vol. 11, pp. 1107, 2021, doi: 10.3390/app11031107.

  20. A. Artoni, M. Gabiccini, M. Guiggiani, and A. Kahraman, “Multi-Objective Ease-Off Optimization of Hypoid Gears for Their Efficiency, Noise, and Durability Performances,” Journal of Mechanical Design, Vol. 133, pp. 121007, 2011, doi: 10.1115/1.4005234.

  21. A. Artoni, M. Guiggiani, A. Kahraman, and J. Harianto, “Robust Optimization of Cylindrical Gear Tooth Surface Modifications Within Ranges of Torque and Misalignments,” Journal of Mechanical Design, Vol. 135, pp. 121005, 2013, doi: 10.1115/1.4025196.

  22. P. Qiu, N. Zhao, and F. Wang, “Optimum microgeometry modifications of herringbone gear by means of fitness predicted genetic algorithm,” Journal of Vibroengineering, Vol. 18, pp. 4964–4979, 2016, doi: 10.21595/jve.2016.17179.

  23. I. Park, “Multi-objective optimization of the tooth surface in helical gears using design of experiment and the response surface method,” Journal of Mechanical Science and Technology, Vol. 24, pp. 823–829, 2010, doi: 10.1007/s12206-010-0117-x.

  24. H. Wang, D. Chen, F. Pan, and D. Yu, “Multi-objective Optimization Design of Helical Gear in Centrifugal Compressor Based on Response Surface Method,” IOP Conference Series: Materials Science and Engineering, Vol. 423, pp. 012040, 2018, doi: 10.1088/1757-899X/423/1/012040.

  25. Z. Tang, M. Wang, Z. Chen, J. Sun, M. Wang, and M. Zhao, “Design of Multi-Stage Gear Modification for New Energy Vehicle Based on Optimized BP Neural Network,” IEEE Access, Vol. 8, pp. 199034–199050, 2020, doi: 10.1109/ACCESS.2020.3035570.

  26. B. Haefner, M. Biehler, R. Wagner, and G. Lanza, “Meta-Model Based on Artificial Neural Networks for Tooth Root Stress Analysis of Micro-Gears,” Procedia CIRP, Vol. 75, pp. 155–160, 2018, doi: 10.1016/j.procir.2018.04.031.

  27. O. D. Mohammed, A. D. S. Bhat, and P. Falk, “Robust multi-objective optimization of gear microgeometry design,” Simulation Modelling Practice and Theory, Vol. 119, pp. 102593, 2022, doi: 10.1016/j.simpat.2022.102593.

  28. J. A. Korta and D. Mundo, “Multi-objective micro-geometry optimization of gear tooth supported by response surface methodology,” Mechanism and Machine Theory, Vol. 109, pp. 278–295, 2017, doi: 10.1016/j.mechmachtheory.2016.11.015.

  29. J. A. Korta and D. Mundo, “A population-based meta-heuristic approach for robust micro-geometry optimization of tooth profile in spur gears considering manufacturing uncertainties,” Meccanica, Vol. 53, pp. 447–464, 2018, doi: 10.1007/s11012-017-0737-7.

  30. U. Urbas, D. Zorko, and N. Vukašinović, “Machine learning based nominal root stress calculation model for gears with a progressive curved path of contact,” Mechanism and Machine Theory, Vol. 165, pp. 104430, 2021, doi: 10.1016/j.mechmachtheory.2021.104430.

  31. P. Langlois, B. Al, and O. Harris, “Hybrid Hertzian and FE-based helical gear-loaded tooth contact analysis and comparison with FE,” Gear Technology, pp. 54–63, Jul. 2016.


[advertisement]