Influence of Tooth Root Contour Deviations on the Tooth Bending Strength
To meet the increasing demands for high-performance applications in power density, new material alloys and heat treatment processes for gears are constantly being developed (Refs. 1–3). The investigation and evaluation of different materials and heat treatments for gears is carried out using S-N curves (Refs. 2,4,5). However, when generating S-N curves for tooth bending strength, the influence of deviations around the tooth root contour is often not considered or recorded with insufficient accuracy, so that an identical tooth root contour is assumed for all variants (Refs. 2,4,5).
Due to the lack of a uniform evaluation standard for the tooth root area, the quality of test gears is usually evaluated only for the tooth flank area using ISO 1328 1:2013 (Refs. 6–10). Stress-increasing effects, such as changes in the tooth root radius due to deformations from the heat treatment, are therefore not considered (Refs. 2,4). In particular, when testing gears with an unground tooth root area, form deviations from the heat treatment and manufacturing deviations from gear hobbing around the tooth root have a direct effect on the test results. These deviations lead to a change in the occurring tooth root stresses and influence the tooth bending strength (Refs. 8,11–16). In the following study, the influence of manufacturing-related geometry deviations around the tooth root on the tooth bending strength is investigated.
State of the Art
Sufficient load carrying capacity of the tooth flank and the tooth root is a basic requirement for gear design as gear damage may lead to a total failure of the gearbox in the worst case (Ref. 17). For this reason, extensive knowledge of the material strength, the heat treatment combination and the occurring stresses in the application are of utmost importance, especially in the design process of high-performance gears.
Factors Influencing the Tooth Bending Strength
The tooth bending strength of gears is obtained by comparing the stress and load capacity around the tooth root (Refs. 14,17). Both stress and load capacity are influenced by various parameters, which, depending on their characteristics, can have a positive or negative effect on the tooth bending strength (Ref. 15).
Factors Influencing the Tooth Root Stress
In addition to the application and the associated load, the stress on a gear is determined by the design of the macro and micro geometry as well as the manufacturing process (Ref. 14). The normal pressure angle, as a macro geometric gear parameter, influences both the length of the bending moment arm and the length of the tooth root chord (Ref. 14). An increase of the normal pressure angle leads to a reduction of the bending moment arm as well as to an increase of the tooth root chord (Ref. 14). Based on the bending beam theory, which can be used to calculate the tooth root stress in a simplified way, a reduction of the bending moment arm leads to a reduction of the bending moment and therefore to a lower tooth root stress (Ref. 17). Increasing the tooth root chord also reduces the tooth root stress because it increases the area moment of inertia of the critical tooth root section (Ref. 18). The area of the critical tooth root section can be further increased by increasing other macro geometric gear parameters, such as the tooth width and the normal modulus, to reduce the tooth root stress (Refs. 14,18). Both the increase of the normal module, with otherwise constant gear parameters, and the increase of the gear width led to a larger area of the critical tooth root section and thus to a reduction of the tooth root stress (Ref. 14,18).
Another geometric factor influencing the tooth root stress is the tooth root contour (Ref. 14). The smaller the existing tooth root radius at the critical section, the greater the stress-increasing notch effect and thus the stress on the tooth root (Refs. 14,15). Taking this relationship into account, various studies have shown that by optimizing the tooth root geometry and leaving the tooth geometry otherwise unchanged, an increase in tooth bending strength of 10–30 percent can be achieved (Refs. 11,12,15,16,19). The optimization potential depends on the initial state of the tooth root geometry and the optimization method used (Refs. 11,12,15,16,19). Conversely, deviations from the specified tooth root geometry due to process variations or manufacturing errors can lead to a reduction in the tooth bending strength (Refs. 13,20).
The load capacity of a gear describes the load limit up to which a gear can be operated without damage and is understood as the strength of the gear material against mechanical load (Refs. 21–23). The load capacity is determined by the selected gear material and the manufacturing processes used, including the process parameters (Refs. 4,5,10,24). A significant influence on the load capacity is the choice of the material and heat treatment combination, as this has a decisive influence on the material properties of a gear (Refs. 4,14,23).
The mean stress sensitivity is one of these material properties and describes the relationship between the fatigue limit stress amplitude and the mean stress present (Ref. 25). In general, the stress amplitude that can be withstood decreases as the mean stress increases (Ref. 25). In addition, surface-hardened components are more sensitive to mean stress in the tensile range than non-surface-hardened components (Refs. 25,26). Nevertheless, gears are usually surface hardened to provide a hard and high-strength surface that can withstand the tangential stresses in the tooth root area and the high pressures in the tooth contact area (Refs. 18,27). Inside the tooth, on the other hand, high ductility is required to withstand the load due to bending stresses and possible impacts (Refs. 18,27). Due to these requirements, case-hardened and nitrided steels are used for gears in many applications (Refs. 17,18).
Another material property is the notch sensitivity, which describes the property of a material to be sensitive to local stress increases due to changes in the shape of the component (Ref. 25). In this context, shape changes are any shapes with high local curvature ratios, such as undercuts in notches or the tooth root of gears (Refs. 14,18,25). Components with such shape changes, if they are made of a material with high notch sensitivity, have a lower load capacity than geometrically identical components made of a material with lower notch sensitivity (Ref. 25). Furthermore, notch effects can also be caused by the structure and condition of the component surface and lead to local stress increases (Refs. 17,18,27). The surface of a gear is determined by the final machining operation and depends on the selected process chain (Ref. 17). For non-ground tooth roots, the surface finish is already defined by the soft machining and the subsequent heat treatment (Refs. 17,18). Feed marks and enveloping cut deviations from soft machining can affect the tooth bending strength negatively due to the notch effect and promote crack initiation on the component surface (Refs. 17,18).
In shot peened gears, the location of crack initiation moves from the surface to the interior of the component due to the high compressive residual stresses near the surface (Refs. 10,28). Crack initiation usually occurs there due to the local stress increase at flaws, i.e., defects in the basic structure, such as non-metallic inclusions (Refs. 10,28). With continued loading, the crack initiation phase then transitions to the crack growth phase, ultimately leading to damage and failure of the application (Ref. 28). Typically, sub-surface damage only occurs at higher numbers of load cycles, in the so-called very-high cycle fatigue (VHCF) and ultra-high cycle fatigue (UHCF) range (Refs. 10,28). Therefore, high-purity steels are used in applications with high load cycles, such as in aircraft engines and rolling bearings, to reduce the number of defects and thus the possibility of crack initiation (Ref. 5).
Procedures for Determining the Tooth Bending Strength
Various procedures and methods can be used to determine the tooth bending strength, some of which differ considerably from each other due to their type and the required effort (Refs. 6,9,14,17,29). One possibility is to carry out experimental investigations in the form of operational and analogue tests to investigate the load capacity (Ref. 17). The tooth bending strength of the tested gears is then derived from the experimental results and the consideration of the occurring tooth root stresses, which can be measured or determined using various calculation methods (Refs. 14,17).
Operational and Analogy Tests
In the industrial environment as well as in the field of research and development, different test rigs are used to test gears and gearboxes. For the investigation of the tooth bending strength, the test rig concepts of the running and pulsator test have prevailed, as they are more economical and ecological than testing on the final product or components of the final product (Ref. 17).
For investigations of the tooth bending strength, the analogy test in the pulsator test rig, also called pulsator test, is often used, since the costs, the time, and the complexity of the investigation method are reduced compared to the running test (Ref. 17). Another advantage of the pulsator test is the decoupling of the variable meshing conditions in the tooth contact, which reduces the number of influencing variables and sources of error on the determination of the tooth bending strength of gears (Ref. 17). This makes it possible to carry out investigations on the fundamental influences of the material and process chain selection as well as the gear geometry on the tooth bending strength (Ref. 17). Due to the changed contact conditions, a conversion factor of fcorr = 0.9 must be considered for the transferability of the pulsator results to the running test (Refs. 17,30).
Procedures for Calculating the Tooth Root Stress
The term tooth root stress means the maximum local principal stress or tangential stress in tooth height direction at the surface of the tooth root (Refs. 14,17). The calculation of the tooth root stress is usually carried out at the location of the 30-degree tangent around the tooth root, since simulative and experimental studies have shown that the damage-critical stress around the tooth root occurs there (Refs. 14,17,18). The standard procedure for calculating the maximum occurring tooth root stress is the application of standardized procedures, such as ISO 6336 3:2019 (Ref. 14). Since these standard calculation methods are analytical methods based on conventions and abstractions, a comparatively fast calculation of the maximally occurring tooth root stress is possible (Ref. 17). In the following, the procedure of tooth root stress calculation according to ISO 6336 3:2019 method B is explained first and then higher-order calculation approaches, such as the finite element method (FEM) are discussed (Refs. 14,17).
The tooth root stress calculation of the standardized method of ISO 6336 3:2019 is based on the bending beam theory (Ref. 14). Based on this approach, the various factors influencing the tooth root stress are considered with the help of correction factors (Refs. 14,31). These correction factors can be determined using different methods, whereby method B of ISO 6336 3:2019 is frequently used due to the quality of the results and the ease of application (Refs. 10,17,18,32). The basis of calculation method B is the determination of the occurring nominal tooth root stress vF0-B (Ref. 14). The nominal tooth root stress vF0-B denotes the maximum local principal stress (tangential stress) in the tooth root area for a flawless gear under static load by means of nominal torque (Ref. 14). The outer point of single tooth contact is used as the point of application of this load for the stress calculation in the running test (Ref. 14). At this point, the nominal torque is transmitted by only one tooth and the bending moment arm of the force application point to the tooth root has the maximum value around single tooth contact (Ref. 14).
With the help of higher-quality calculation methods, such as FEM, the locally occurring tooth root stresses on entire gears can be calculated, taking into account the real gear geometry (Ref. 17). Due to the high calculation effort as well as the required pre- and post-processing for the determination of the relevant results, general commercial FE programs are usually not used for gears (Refs. 17,32). Tooth contact analysis programs specialized for gears simplify this process for the user (Refs. 17,32). Furthermore, due to the combination of analytical calculation methods with the FEM, the required calculation effort can be reduced in FE-based tooth contact analysis, so that extensive variant simulations for micro geometry optimization are possible (Refs. 17,32).
Tolerancing of Gears
[advertisement]
Geometric deviations from the designed nominal contour of a gear due to tool wear and process variations during manufacturing can affect the tooth root and tooth flank load capacity. This influence must be considered in the design process with the aid of quantitative manufacturing tolerances to ensure that the manufactured gears meet the required specifications. Due to different geometric conditions and special features, a classic distinction is made between the areas of the tooth flank and the tooth root (Ref. 17).
ISO 21771:2007 provides the basis for tolerancing the tooth flank of involute gears (Ref. 33). It contains clear definitions and specifications of the various gear parameters and explains the geometric and mathematical relationships between them (Ref. 33). In addition to the macro geometric parameters of a gear, the various flank modifications are also described and explained (Ref. 33). Based on this, ISO 1328 1:2013 introduces an ISO tolerance classification system, which enables an objective evaluation of manufactured gears based on defined measured variables and permissible tolerance limits (Ref. 7). The gear quality is differentiated with the help of eleven tolerance classes IT1 to IT11, whereby IT1 denotes the lowest tolerance range and thus the highest quality and IT11 the lowest manufacturing quality with the largest possible tolerance range (Ref. 7). The application guidelines ISO/TR 10064 1:2019 and VDI/VDE 2612 supplement the IT classification system with information on measurement methods, measuring devices and the evaluation and interpretation of the measurement results [34,35]. The standardization of the flank tolerance creates a common basis for gear manufacturers and gear buyers, which enables a uniform conformity assessment of gearing in the area of the tooth flank (Ref. 7).
For the area of the tooth root, no standardized assessment basis or IT classification system has yet been created (Refs. 8,11). Due to the lack of a standard, only the tooth root diameter is usually tolerated in production drawings of gears and sometimes supplemented by the specification of a minimum tooth root radius (Refs. 8,11). On the one hand, this gives gear manufacturers great freedom in designing and optimizing the tooth root contour to increase the tooth bending strength (Ref. 8). However, this freedom also bears the risk that the tooth root contour is neglected during quality control and that unwanted tooth root fractures occur in the application due to manufacturing deviations (Ref. 8).
Objective and Approach
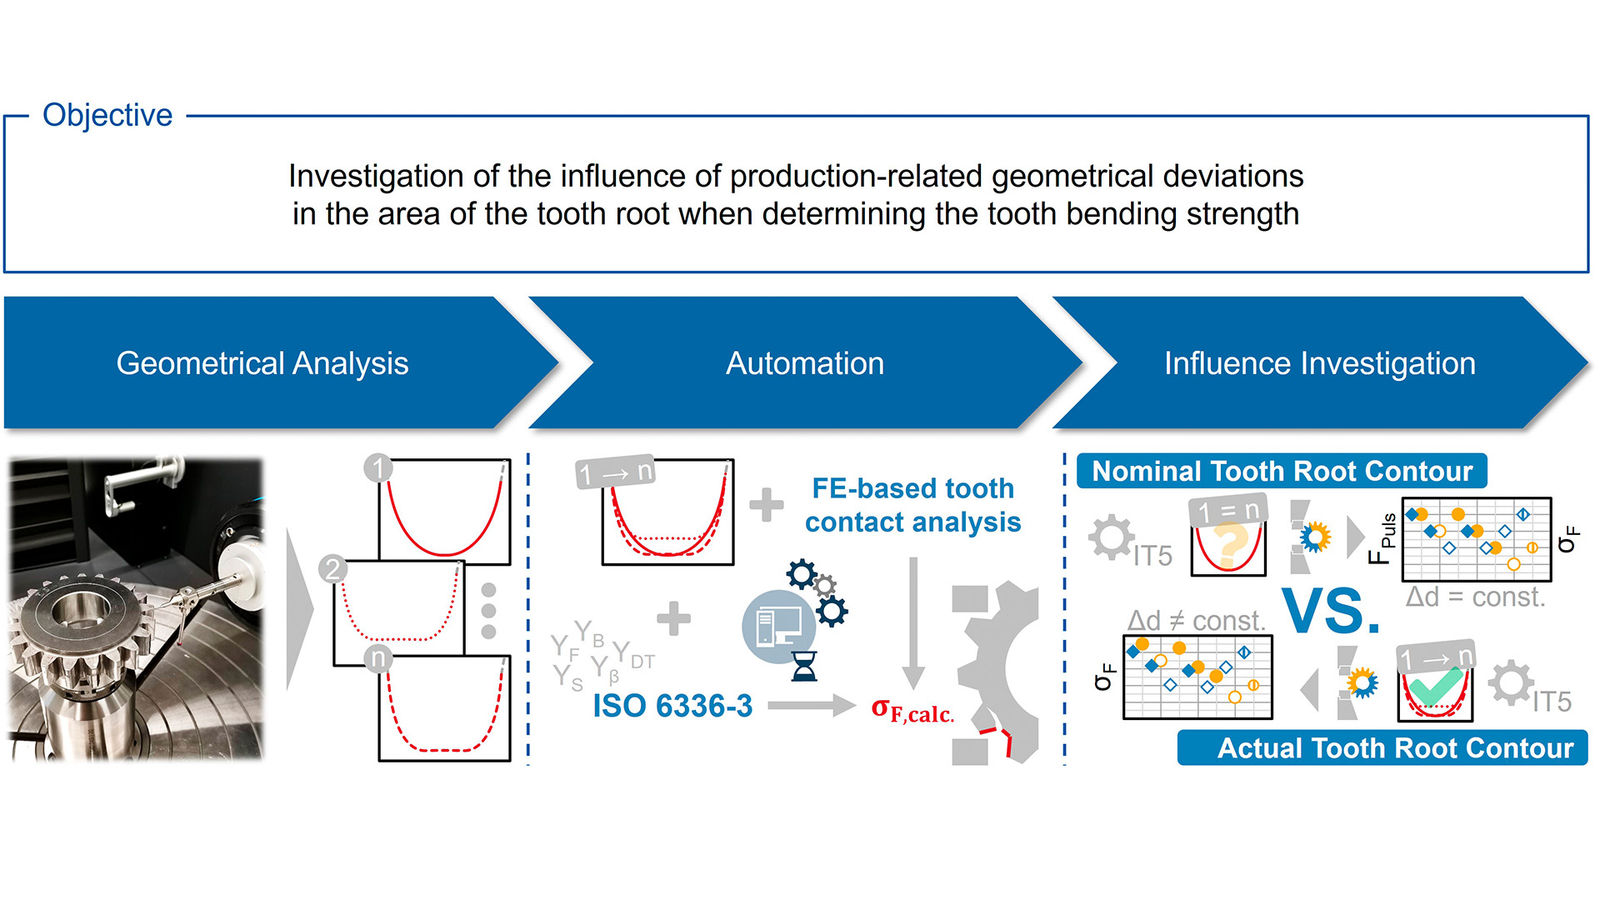
The state-of-the-art shows that a large number of parameters influence the tooth bending strength of a gear. One of these influencing variables is the tooth root geometry, which can significantly increase or decrease the tooth bending stress depending on its characteristics (Refs. 8,11,15). Nevertheless, there are no uniform evaluation standards for tolerancing the tooth root contour. As a result, only the tooth flank is usually considered in the quality control of gears and classified with the help of ISO 1328 1:2013 (Ref. 7). A missing or insufficiently precise quality control for the area of the tooth root can lead to uncertainties in the application as well as in the performance and evaluation of load capacity tests. For this reason, this study aims to investigate the influence of production-related geometric deviations in the area of the tooth root when determining the tooth bending strength (see Figure 1).
Figure 1—Objective and approach.
The first step is to measure the manufactured tooth gap contours—space between two adjacent teeth—and then analyze the production-related geometric deviations around the tooth root. In addition to recording manufacturing deviations due to tool wear and process variations, the analysis is also used to investigate the distortion in the tooth root area for different material and heat treatment combinations. Based on the geometry analysis, the tooth root stress calculation is automated, considering the measured tooth gap contours. This allows the calculation of actual tooth root stresses to be considered when performing and evaluating pulsator tests to determine the tooth bending strength. The automation includes both the stress calculation according to ISO 6336 3:2019 and the possibility to calculate the tooth root stresses using the FEA-based tooth contact analysis FE-STIRNRADKETTE (STIRAK) (Ref. 14). A uniform tooth root stress calculation procedure is required for the investigation of several variants with different production-related geometry deviations and is currently not sufficiently standardized to ensure comparability of the results and to avoid errors in the evaluation. The automated tooth root stress calculation is then used to investigate the influence of manufacturing geometry deviations on the tooth root stress and the effect on the determination of the tooth bending strength.
Analysis of Production-Related Geometry Deviations
The following section describes the results and findings of the geometric analysis carried out. To classify the results of the geometry analysis, the test gears examined and their differences are presented. The subsequent measurement of the tooth gap contours of all gear variants is used to determine the respective production-related geometry deviations for each variant and to compare the deviations of the individual variants with each other.
Test Gears—Variation of Material and Heat Treatment
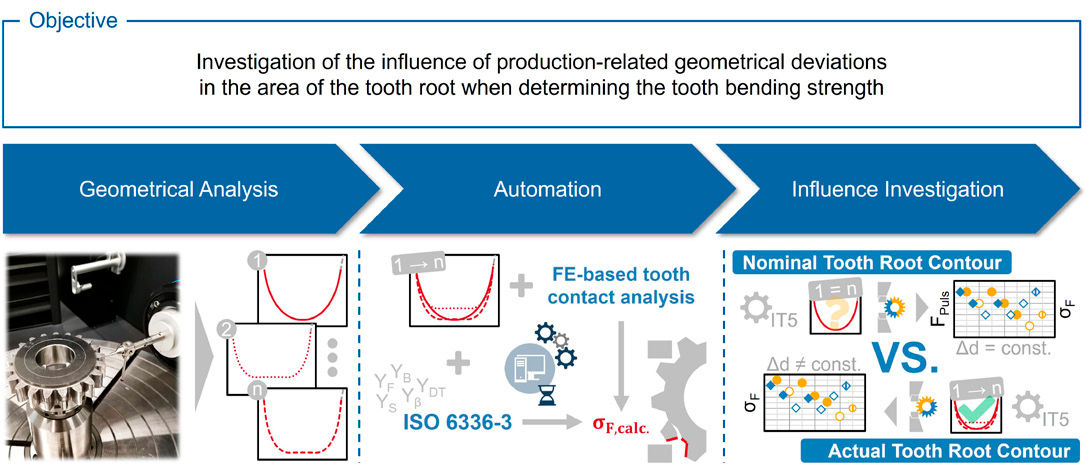
The test gears considered in the following are part of a research project aimed at investigating the gear load capacity of different material-heat treatment combinations at an operating temperature of 180°C (see Figure 2). The gears being measured and tested are spur gears with a normal module of mn = 5 mm and a normal pressure angle of an = 20°. The gears each have z = 21 teeth and a tooth width of b = 20 mm. The flank modification of the gears includes a tip relief of Ca = 90 μm and starts at a diameter of dCa = 114.3 mm.
Due to the focus of the research project, the investigated variants differ in terms of the used material and the applied heat treatment (see Figure 2). However, the other steps in the manufacturing process chain were identical for all variants. In the first step, the gear blanks were made from the material supplied as round steel and then turned to the required dimensions. This was followed by precutting in the hobbing process using the same process parameters for all variants. The subsequent heat treatment was varied according to the different specifications. The heat treatment was then followed by hard finishing, which involved the profile grinding of the gear tooth flanks. The tooth root was not ground during this process. Finally, the gears were shot-peened and superfinished to further increase the tooth bending strength. Subsequent roughness measurements around the tooth root showed that, due to the superfinishing process, all examined variants had a comparable surface roughness.
Figure 2—Test gears—variation of material and heat treatment.
In this study, five of the thirteen variants of the research project are examined in more detail. The first two variants are made from 20MnCr5 and have been surface hardened using two different heat treatment processes. The first process is gas carbonitriding with oil quenching, followed by tempering at a tempering temperature of T = 250°C. The second heat treatment is low-pressure carburizing with high-pressure gas quenching, followed by salt bath heating (GS540) and a final tempering at T = 190°C. For the third variant, Hybrid55 (X20NiCrAlMoV6-5-2-1) was used, and the gears were carburized and then plasma nitrided. The gears of the fourth variant are made of Ovako497 (42NiSiCrMo8-7-3) and were produced by a low-pressure carbonitriding process with high-pressure gas quenching and subsequent tempering at T =210–250°C. To produce the fifth variant, the used material was M50NiL, and the heat treatment of the test gears was gas carbonitriding in a double hardening process.
Production-Related Geometry Deviations
To analyze the production-related geometric deviations, it is necessary to record the manufactured tooth contours of all five variants as accurately as possible. The necessary measurements were carried out using a Klingelnberg P16 tactile precision measuring center. The required nominal tooth gap contour was created using the FE-based tooth contact analysis based on the tool reference profiles of the soft and hard machining processes. Using this nominal contour, the tactile precision measuring center can measure the manufactured tooth gap contours and determine the deviation between the specified nominal contour and the manufactured tooth contours. The tooth gap contours were measured for all teeth of the five variants that will be loaded in the pulsator during the testing. Since four pulsator tests with two clamped teeth each can be carried out on every test gear, eight tooth gaps per gear have been measured. The tooth contours were always recorded as a 2D line in the center of the tooth width. This allows the actual tooth root stresses to be considered in the subsequent evaluation of the fatigue tests. In addition, the measurement results can be used to analyze production-related geometry deviations, both within a variant and between the different variants.
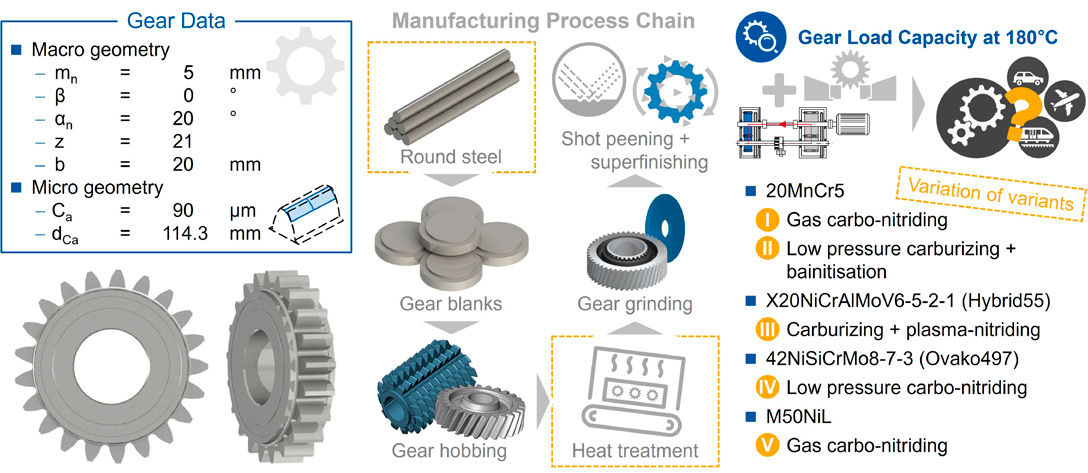
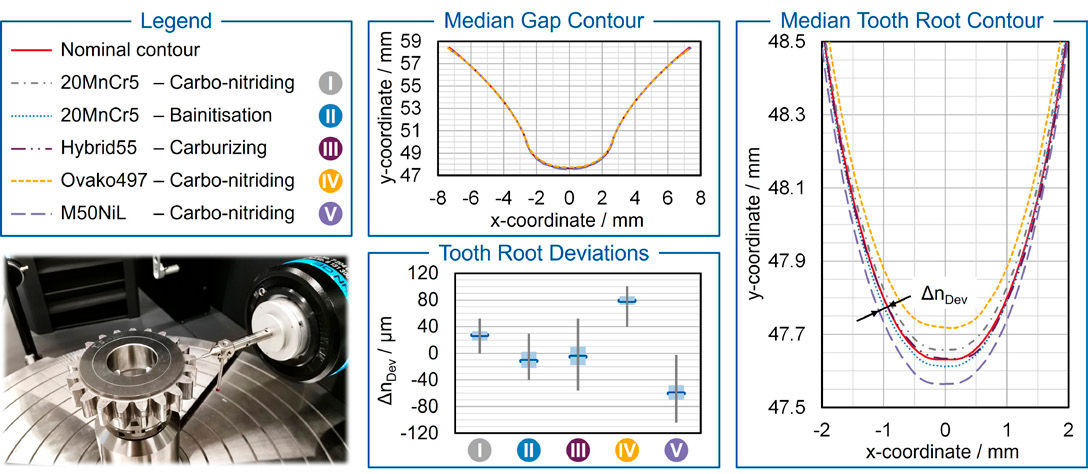
The results of the tooth gap contour measurements carried out to investigate the geometry deviation within a variant are shown in Figure 3 as an example for variant II (20MnCr5 bainitization). Looking at the entire gap contour, the measured mean gap contour of variant II is in good agreement with the nominal contour (see Figure 3—top center). However, closer examination of the gap contour in the tooth root area shows that the median gap contour in the tooth root area is below the nominal contour (see Figure 3—right). For a better classification of the deviations, the distance in normal direction DnDev between the nominal contour and the measured contour, also called the actual contour, was calculated for each measuring point of all measured gears. Since the tooth flank area was ground during hard finishing without machining the tooth root area, the evaluation of the production-related geometry deviations is carried out separately for the tooth flank area and the tooth root area (see Figure 3—bottom center). The box plot shows that the interquartile range IQR of the normal distance between the nominal and actual contour for the tooth root area (IQRII,root = 24.6 μm) is significantly larger than that for the tooth flank area with IQRII,flank = 4.3 μm. As the interquartile range is the difference between the 75 percent and 25 percent quantiles, it can be concluded that the geometry deviations are significantly more scattered in the root area than in the flank area. This difference in the tooth flank area results from the removal of the grinding allowance, which compensates for any deviations from tool wear during the hobbing process or distortions from heat treatment. However, there is no correction for this deviation in the tooth root area because, as in many applications, the root has not been ground. This results in a median geometry deviation of ΔnDev,root,median = -11.5 μm for the tooth root area. However, an evaluation of the minimum and maximum normal distance is not possible because measurement outliers due to contamination in the measurement process, for example, due to dust, cannot be excluded. However, for the sake of completeness of the geometry analysis, the scatter range between the minimum and maximum normal distance is plotted in the box plot diagram (see Figure 3).
Figure 3—Comparison of production-related geometry deviations within a variant.
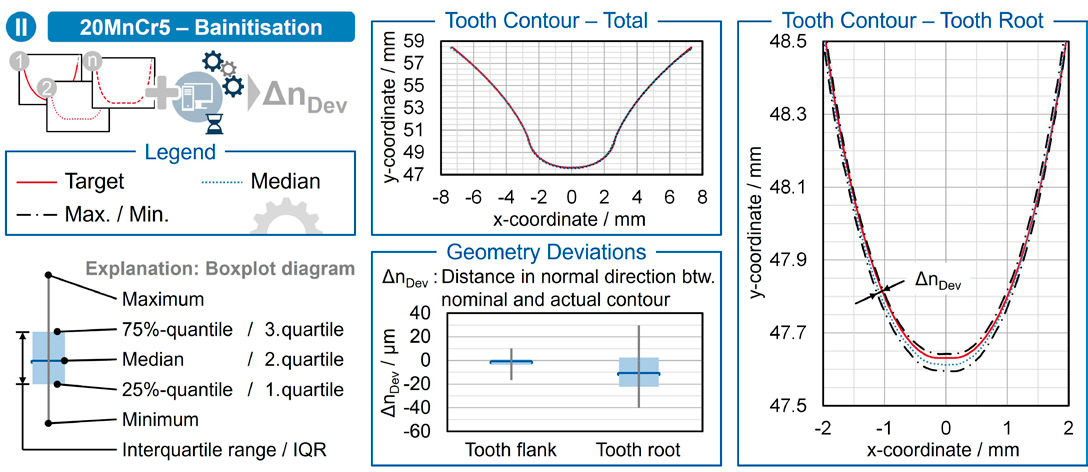
In the following, the production-related geometry deviations between the variants I to V are presented. For the sake of clarity, only the mean tooth gap contours of the five variants are shown in Figure 4. Looking at the median gap contour, there is no difference between the variants (see Figure 4—top center). However, a closer look at the tooth root area shows that the median root contour of variant IV (Ovako497) and variant V (M50NiL) clearly deviates from the nominal contour and the other variants (see Figure 4—right). The root diameter of variant IV (dF,IV = 95.44 mm) is ΔdF,IV = +174 μm above the root diameter of the nominal contour (dF,nominal = 95.26 mm). variant V, on the other hand, has a root diameter of dF,V = 95.13 mm, which is ΔdF,V = -133 μm smaller than the nominal contour. The deviations of the other three variants are smaller in comparison. The tooth root contour of variant III (Hybrid55) shows the highest agreement with the nominal contour.
Figure 4—Comparison of production-related geometry deviations between the variants.
The box plot diagram, which shows the normal deviation distances of all measurement points in the tooth root area from the nominal contour, confirms these findings (see Figure 4—bottom center). It can also be seen that the scatter of the normal deviation distances varies with each variant. The lowest scatter in the root area is found for variant I with IQRI = 14.1 μm and variant IV with IQRIV = 13.0 μm. In comparison, the interquartile ranges of the other variants are IQRII = 24.6 μm,IQRIII = 27.9 μm, and IQRV = 21.9 μm. As the manufacturing process chain of the variants differs only regarding the applied heat treatment, it is reasonable to assume that the deviations are due to this difference. However, the influence of the hobbing process cannot be excluded, as no tooth contour measurements were made between soft machining and the heat treatment process. Therefore, for future studies focusing on the identification of the process step with the greatest manufacturing variation, it is recommended that the tooth root geometry be recorded after each manufacturing step.
Automated Tooth Bending Stress Calculation with the Consideration of Measured Tooth Gap Contours
Based on the geometry analysis carried out, the following section presents a procedure for the automated tooth root stress calculation, considering the measured tooth gap contours. The automation includes both the stress calculation according to ISO 6336 3:2019, hereafter referred to as the standard-based method, and the possibility of calculating tooth root stresses using the FE-based tooth contact analysis STIRAK (Ref. 14). The automation allows a reproducible and consistent calculation of the actual tooth root stresses when performing and evaluating tooth bending strength tests on the pulsator. A consistent stress calculation procedure is essential when investigating multiple variants to ensure comparability of results and avoid errors in the interpretation.
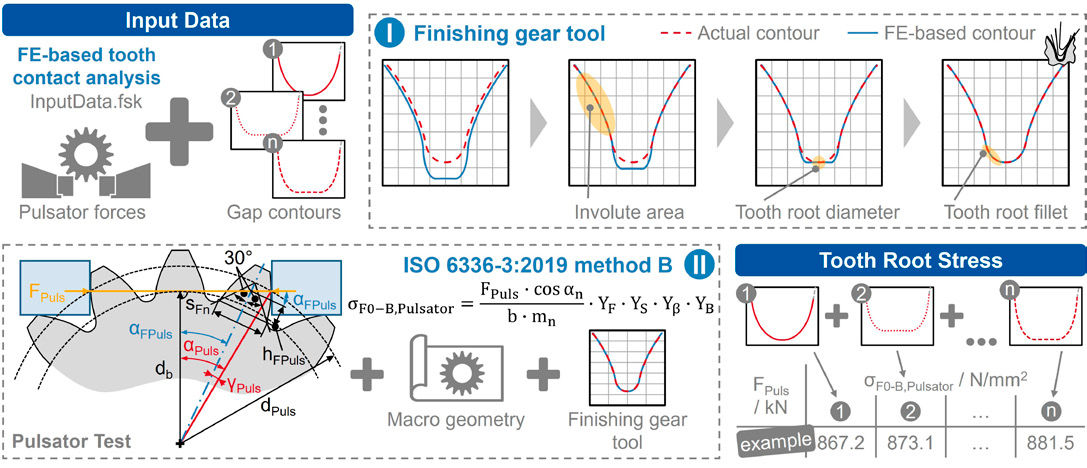
As input variables for the automatic tooth root stress calculation, the results of the gap contour measurements, an input file of the test gears for the FE simulation program, and the pulsator forces for the pulsator tests are required. All three input data are used for the stress calculation according to ISO 6336 3:2019 and for the FE simulation. Figure 5 shows the procedure for the standard-based tooth root stress calculation. In addition to the known macro geometric gear parameters, such as normal module, normal pressure angle, number of teeth, and some other parameters, the actual manufactured root diameter and tooth root radius, as well as the generating profile shift coefficient used to machine the tooth gap contour, are required to perform the stress calculation. Therefore, the first step is to create a hypothetical manufacturing tool that could theoretically produce a measured root gap contour in one operation. The data of the manufacturing tool in the input file is used as a starting value for the iteration of the hypothetical manufacturing tool. If the data is a protuberance tool, only information describing the basic rack profile of a simple production tool is considered, such as the reference profile angle, the addendum coefficient, the dedendum coefficient, and the tool tip corner rounding coefficient. The start value for the tool tip corner rounding factor is set to taP0,Start = 0.05, regardless of the used basic rack profile, to ensure that the basic rack profile of the hypothetical manufacturing tool is generated and to avoid a tool tip that is far from reality. The iteration then starts with a stepwise adjustment of the generating profile shift coefficient in order to fit the generated FE-based contour to the measured contour in the area of the tooth flank. The fitting quality is assessed using the median normal distance deviation ΔnDev,median between the two curves in the tooth flank observation area (see Figure 5). The addendum coefficient of the hypothetical finished gear tool is then adjusted using Equation 1.
(1)
where
h*aP0 is addendum coefficient
dF,FE-based is tooth root diameter of the FE-based contour
dF,actual is tooth root diameter of the actual contour
Figure 5—Procedure for automated tooth root stress calculation using ISO 6336-3:2019.
The third adjustment to the basic rack profile of the manufacturing tool concerns the area of the tooth root that is machined by the tool tip corner rounding of the manufacturing tool. To achieve the best possible match between the FE-based contour and the actual contour, the tool tip corner rounding coefficient is changed step by step in an iterative process. As with the tooth flank iteration, the fitting quality is checked after each iteration step using the median normal deviation distance ΔnDev,Median between the two curves in the tooth root area. A maximum deviation of ΔDev,Median ≤ 1 μm was used as a stop criterion for the iteration of the flank area and the tooth root area.
Once the basic rack profile of a suitable hypothetical manufacturing tool has been fully determined, the second step is to calculate the actual tooth root stress using the equation shown in Figure 5 (Ref. 14). When calculating the required correction factors, it should be noted that the point of force application in the pulsator is often not at the outer point of single tooth contact and is dependent on the number of teeth clamped. The resulting geometric relationships are shown in Figure 5, bottom left, and must be taken into account when calculating the correction factors YF and YS. In addition, the generating profile shift value from the tool iteration must be used. The required tooth root radius results from the tooth root radius of the basic rack profile of the gear ρfP and corresponds to the tool tip corner rounding ρaP0 of the hypothetical manufacturing gear tool (Ref. 37). Considering the relationships above, the equations from ISO 6336 3:2019 are then used to calculate the actual tooth root stress of the tooth gap contour under consideration (Ref. 14).
For the tooth root stress calculation with the FE-based tooth contact analysis, the measured tooth gap contours are first smoothed using a spline approximation. The smoothed tooth gap contours can be read directly by the used tooth contact analysis program and considered when building the FE-model. The implemented FE meshing process of the program requires a smoothed tooth gap contour as the contour normally used to determine the meshing direction of the FE mesh. Any contour discontinuities in the measured and unsmoothed tooth gap contours would therefore lead to an unfavorable FE mesh in some cases and thus negatively affect the results. Furthermore, the rolling position of the FE-based simulation, which corresponds to the contact conditions in the pulsator test, must be determined, as the tooth contact analysis simulates the quasi-static tooth flank contact of a running test. The rolling position is determined by comparing the pulsator diameter dPuls, which represents the diameter of the force application in the pulsator test, with the contact line diameter of all rolling positions of the FE-based simulation. The pulsator diameter dPuls results from the base tangent length WK of the number of clamped teeth k and defines the position of the contact line on the tooth flank in the pulsator test. The rolling position with the best fit is used for further tooth root stress calculation. The required simulation torque is determined by iteratively adjusting the torque until the sum of the tooth normal forces of the selected contact line matches the desired pulsator force. Finally, the tooth root stresses occurring in the pulsator are calculated for each measured tooth gap contour, considering the simulation torque and the selected rolling position.
Influence of Geometry Deviations on the Tooth Bending Strength
In the following section, the influence of the geometry deviations on the tooth bending strength is examined. Using the two calculation methods presented, the effect of the measured geometry deviations on tooth root stress is first determined, and the difference between the two calculation methods is examined. Furthermore, the influence of considering the measured tooth root contours in the determination of the tooth bending strength is shown by means of experimental investigations on the measured test gears.
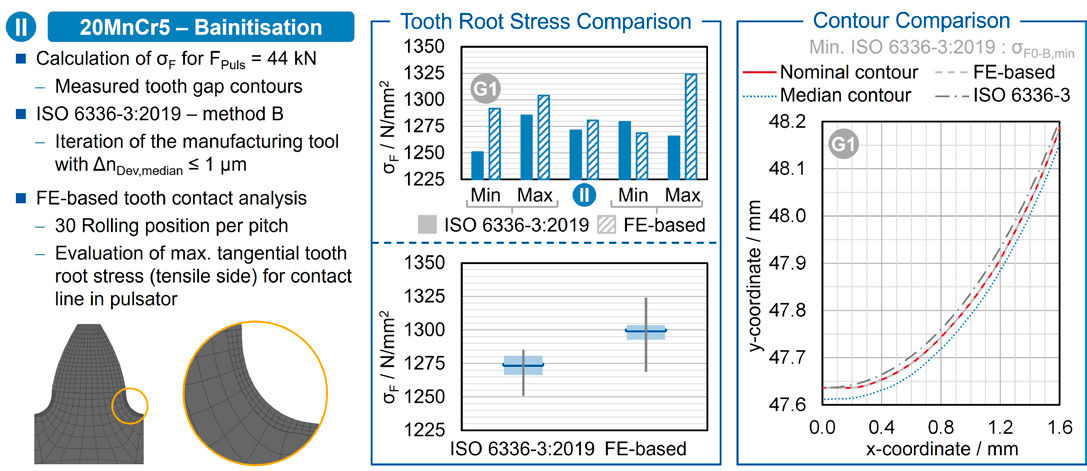
The results of the investigation into the influence of production-related geometry deviations on tooth root stress are shown in Figure 6 as an example for variant II (20MnCr5 – bainitization). The tooth root stresses were calculated for all measured tooth gap contours of variant II at a uniform pulsator force of FPuls = 44 kN with four clamped teeth. A median normal distance of nDev,median ≤ 1 μm was chosen as the stopping criterion for the iteration of the hypothetical manufacturing tool for the calculation method according to ISO 6336 3:2019 Method B (Ref. 14). For the tooth root stress calculation using the tooth contact analysis Stirak (version 4.3.2.6), a resolution of 30 rolling positions per pitch was used. This is a compromise between the required calculation time and the resolution accuracy. Any increase in the number of rolling positions reduces the distance between the selected contact line and the desired pulsator diameter dPuls, thus improving the calculation accuracy. On the other hand, the required calculation time is increased as a higher number of rolling positions is calculated in the tooth contact analysis. To compare the results between the two calculation methods, the tooth contact analysis evaluates the maximum tangential tooth root stress under tensile load.
Figure 6—Influence of manufacturing scatter on the tooth root stress.
The bar chart in Figure 6 shows the calculated tooth root stresses of five different tooth gap contours with both calculation methods. The five selected tooth gap contours are the gap contours with the minimum and maximum tooth root stress of both calculation methods, as well as the tooth root stress of the median tooth gap contour from Figure 4. As can be seen from the bar chart, the two calculation methods provide different tooth root stresses for any of the five selected tooth gap contours. Furthermore, the minimum and maximum tooth root stresses of the two calculation methods occur on different tooth gap contours. These differences can be attributed to the fundamental differences between the two calculation methods as well as to the different fitting quality of the tooth gap contour (see Figure 6—right). Due to the iteration of the hypothetical manufacturing tool for the standard calculation, a highly accurate fit of the actual tooth root contour is not possible for every tooth gap contour, as can be seen, for example, in the contour comparison of gap contour G1 in Figure 6. The fitting quality is defined by the stop criterion for the iteration nDev,median ≤ 1 μm, and by the rolling simulation of the hypothetical manufacturing tool for generating the tooth root contour. Deviations between the measured and the used tooth root contour for calculation cannot be excluded. For the FE-based simulation, the measured tooth root contours are only smoothed to achieve a higher fitting quality (see Figure 6). Due to these limitations, the FE-based calculation tends to calculate higher tooth root stresses than the standard calculation (see Figure 6—boxplot diagram).
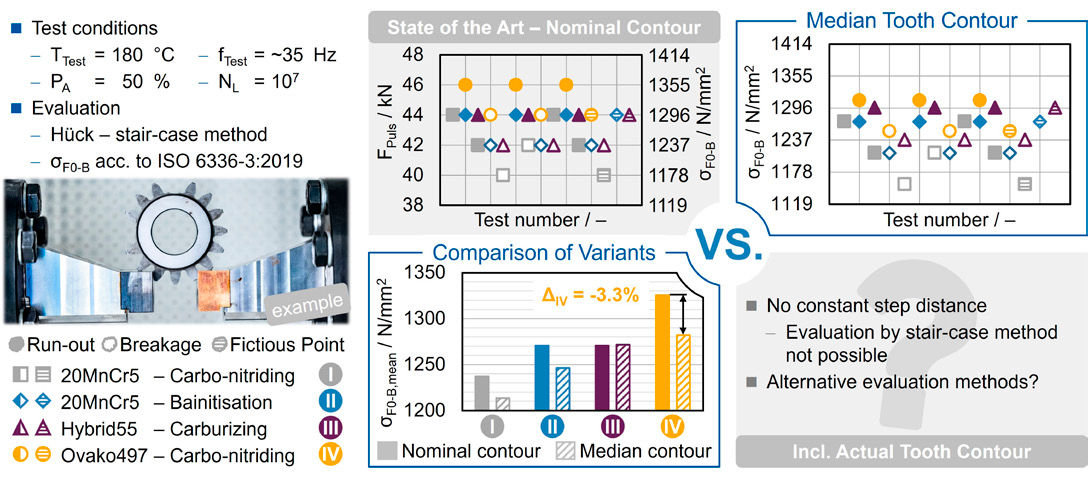
In the following, the influence of the tooth root contour on the determination of tooth bending strength in the pulsator is investigated for the presented variants I to IV (see Figure 7). For this purpose, pulsator tests were carried out on the measured and presented variants at an ambient temperature of TTest = 180°C. The limiting number of load cycles in the pulsator was NL = 3·106 load cycles and the test frequency was approximately fTest ≈ 35 Hz. The tests were evaluated using the IAGB/Hück staircase method for a failure probability of PA = 50% (Ref. 37). The pulsator forces were converted for the corresponding tooth gap contour using the calculation method presented according to method B of ISO 6336 3:2019 (nominal contour vs. median tooth root contour of the respective variant) (Ref. 14). The fracture surfaces of all variants showed no conspicuity. Final material tests on the influence of the operating temperature T = 180°C on the material structure are still pending.
Figure 7—Influence of the tooth root contour on the determination of tooth bending strength in the pulsator.
Assuming that all variants have the same tooth gap contour, the test results of all variants can be plotted on the same graph with the ordinates of the pulsator force FPuls (load) and the ordinate of the equivalent tooth root stress σF0-B (stress) (see Figure 7—top center). With the same load for all variants and assuming the same tooth gap contour, the tooth root stress is the same for all variants. However, this is not the case when considering the measured mean tooth contour of the variants. In this case, the variants can only be plotted on a graph with only one ordinate, the load or stress (see Figure 7—top right). For example, the consideration of variant IV shows that by considering the median tooth root contour, the top load level is reduced by ΔσF0-B,IV = -44.5 N/mm2 compared to the assumption of the nominal contour. On the other hand, considering the median tooth root contour makes only a small difference in variant III. This is due to the smaller deviation between the nominal contour and the median tooth root contour (see Figure 4). This difference becomes particularly clear when comparing the variants (see Figure 7—bottom center). Considering the median tooth root contour, the mean bending strength of variant IV is reduced by ΔIV = 3.3%, whereas the tooth bending strength of variant III remains almost unchanged. The difference in tooth root stress between variant III and IV is ΔσF0-B,IV III,nominal contour = 54.8 N/mm2, using the nominal contour, and is reduced to ΔσF0 B,IV III,mean tooth root contour = 10.6 N/mm2 when the respective mean tooth root contour is considered.
This means that the two variants are much closer to each other due to the consideration of the mean tooth root contours. This change shows that the geometrical influence should be included in the evaluation of durability tests focusing on material and heat treatment, as it is not a material influence but an influence of the manufacturing process chain. A further improvement in the evaluation of material tests for tooth bending strength could be achieved by considering the actual tooth gap contours. However, this would require an adaptation of the test procedure to obtain a constant step distance, as a constant step distance is a requirement for the evaluation according to IAGB/Hück (Ref. 37). An alternative is to use another evaluation method, such as maximum likelihood, which does not require a constant step distance for the evaluation (Ref. 38). However, statistical research has already shown that a maximum likelihood estimation does not provide estimates of mean and variance that are true to expectation, making this method of limited use for determining fatigue life values (Ref. 39).
Summary and Outlook
The investigation of various combinations of materials and heat treatments is usually carried out by the evaluation of S-N curves. When generating S-N curves for the tooth bending strength, the influence of deviations around the tooth root should be considered so as not attribute the influence of manufacturing deviations to the S-N curves of the investigated materials. Unfortunately, an evaluation of the test gear quality is usually only carried out for the area of the tooth flank by means of ISO 1328-1:2013 due to the lack of a uniform evaluation standard for the area of the tooth root. Accordingly, stress-increasing effects, such as tooth root radius changes due to deformations from different heat treatments, are often not considered.
For this reason, the objective of this study was to investigate the influence of geometry deviations around the tooth root when determining the tooth bending strength. In the first step, geometry deviations of various test gears of different material-heat treatment combinations were measured. The analysis of the deviations showed that a grinding process can reduce the geometric deviations after heat treatment. Furthermore, the extent of the geometric deviations depends on the material-heat treatment combination. To reduce sources of error and standardize the stress calculation, the tooth root stress calculation was then automated with the consideration of measured tooth gap contours using an FE-based method and the procedure according to ISO 6336 3:2019. With the aid of the automated calculation method, it was possible to show that a consideration of the measured tooth gap contours is necessary when comparing different material-heat treatment combinations with non-ground tooth roots. Without taking the measured tooth gap contours into account, the evaluation of different variants is only possible with a high degree of uncertainty, since the material difference is not exclusively examined, but is superimposed by the influence of the different tooth root geometries. Therefore, the recording and consideration of the tooth root contours is necessary for the determination of the tooth root strength of different materials and should be considered in every material investigation.
Currently, there is neither a standard for the evaluation of the tooth root contour, nor have systematic investigations been carried out on the influence of contour deviations in the tooth root area, with the focus on the tooth bending strength. Therefore, investigations to determine quantifiable measured variables that can be used to evaluate the gear quality in the tooth root area are necessary. Based on these findings, an evaluation standard for the area of the tooth root can then be derived. Furthermore, a test specification for carrying out tooth bending strength tests would increase national and international comparability. Due to the statistical differences between different evaluation methods, a uniform test procedure and evaluation are necessary to ensure comparability between different studies.
References
Brecher C., Löpenhaus C., Goergen F. and Mevissen D., 2017,“Crack Propagation Analysis of Pitting Damages of High-Strength Material Systems in Gear Applications,” VDI-Berichte(2294.1), pp. 283–292.
Zoch H.-W., Stahl K., Saddei P., Schurer S. and Günther C., Eds., 2017. Alternative mehrphasige Randschichtgefüge beim Einsatzhärten zur Steigerung der Festigkeitseigenschaften von verzahnten Getriebebauteilen, Frankfurt a.M.
Goergen F., Mevissen D., Masaggia S., Veneri E., Brimmers J. and Brecher C., 2020,“Contact Fatigue Strength of Austempered Ductile Iron (ADI) in Gear Applications,” Metals, Vol. 10 No. 9, pp. 1–11.
Stenico A., 2007,“Werkstoffmechanische Untersuchungen zur Zahnfußtragfähigkeit einsatzgehärteter Zahnräder,” Ph.D. thesis, TU Munich, Munich.
Trippe M., Löpenhaus C., Brecher C., Kamjou L. and Löthman E., 2020,“Tooth Root Testing of Steels with High Cleanliness,” Gear Solutions, Vol. 18 No. 7, pp. 29–36.
Zuber D., 2008,“Fußtragfähigkeit einsatzgehärteter Zahnräder unter Berücksichtigung lokaler Materialeigenschaften,” Ph.D. thesis, Laboratory for Machine Tools and Production Engineering (WZL) of RWTH Aachen, RWTH Aachen University, Aachen.
ISO 1328-1:2013,“Cylindrical gears—ISO system of flank tolerance classification—Part 1: Definitions and allowable values of deviations relevant to flanks of gear teeth”.
Chaphalkar N., Hyatt G. and Bylund N., 2014,“Analysis of Gear Root Forms: A Review of Designs, Standards and Manufacturing Methods for Root Forms in Cylindrical Gears,” Gear Solutions, Vol. 12 No. 2, pp. 48–56.
Henser J., 2015,“Berechnung der Zahnfußtragfähigkeit von Beveloidverzahnungen,” Ph.D. thesis, Laboratory for Machine Tools and Production Engineering (WZL) of RWTH Aachen, RWTH Aachen University, Aachen.
Schurer S., 2016,“Einfluss nichtmetallischer Einschlüsse in hochreinen Werkstoffen auf die Zahnfußtragfähigkeit,” Ph.D. thesis, TU Munich, Munich.
Kapelevich A. and Shekhtman Y., 2009,“Tooth Fillet Profile Optimization for Gears with Symmetric and Asymmetric Teeth,” Gear Technology, Vol. 26 No. 7, pp. 73–79.
Frühe T., 2012,“Berechnung und Minimierung der Zahnfußspannung von Standard- und LowLoss-Verzahnungen,” Ph.D. thesis, TU Munich, Munich.
Nigade V. and Wink C. H., 2018,“Impact of root geometry manufacturing deviations from a theoretical hob rack on gear bending stress,” AGMA Fall Technical Meeting.
ISO 6336-3:2019,“Calculation of load capacity of spur and helical gears—Part 3: Calculation of tooth bending strength”.
Pollaschek J., 2020,“Fertigungsgerechte Zahnfußoptimierung von Stirnrädern,” Ph.D. thesis, Laboratory for Machine Tools and Production Engineering (WZL) of RWTH Aachen, RWTH Aachen University, Aachen.
Chao C.-X., 2022,“Strategies for Optimizing the Tooth Root Load Capacity of High-Performance Gears,” Ph.D. thesis, BTU Cottbus-Senftenberg, Cottbus and Senftenberg.
Klocke F. and Brecher C., 2017. Zahnrad- und Getriebetechnik: Auslegung-Herstellung-Untersuchung–Simulation, Hanser, Munich.
Uelpenich R. and Tenberge P., 2019, “Fast tooth root load capacity optimization based on improved design of hob geometry,” MATEC Web Conf., 287, pp. 1–9.
Wirth X., 1977,“Über den Einfluss von Schleifkerben oberflächengehärteter Zahnräder auf die Dauerfestigkeit und die Lebensdauer im Zweistufenversuch,” Ph.D. thesis, TU Munich, Munich.
Radaj D. and Vormwald M., 2007. Ermüdungsfestigkeit: Grundlagen für Ingenieure, Springer, Berlin.
Arndt K.-D., Brüggemann H. and Ihme J., 2011. Festigkeitslehre für Wirtschaftsingenieure, Vieweg+Teubner, Wiesbaden.
ISO 6336-5:2016,“Calculation of load capacity of spur and helical gears—Part 5: Strength and quality of materials”.
Bretl N. T., 2011,“Einflüsse auf die Zahnfußtragfähigkeit einsatzgehärteter Zahnräder im Bereich hoher Lastspielzahlen,” Ph.D. thesis, TU Munich, Munich.
FKM Guideline, 2003,“Rechnerischer Festigkeitsnachweis für Maschinenbauteile”.
Brinck P., 1989,“Zahnfußtragfähigkeit oberflächengehärteter Stirnräder bei Lastrichtungsumkehr,” Ph.D. thesis, TU Munich, Munich.
Murakami Y., 2019. Metal Fatigue: Effects of Small Defects and Nonmetallic Inclusions, Elsevier Ltd., London.
Fuchs D., Schurer S., Tobie T. and Stahl K., 2019,“A model approach for considering nonmetallic inclusions in the calculation of the local tooth root load-carrying capacity of high-strength gears made of high-quality steels,” J. Mech. Eng. Sci., Vol. 233 Nos. 21–22, pp. 7309–7317.
Höhn B.-R., Winter H. and Stahl K., 1999. Lebensdauerstatistik, Research Association for Power Transmission Engineering (FVA), Frankfurt a.M.
ISO 6336 1:2019,“Calculation of load capacity of spur and helical gears—Part 1: Basic principles, introduction and general influence factors”.
Hemmelmann J. E., 2007,“Simulation des lastfreien und belasteten Zahneingriffs zur Analyse der Drehübertragung von Zahnradgetrieben,” Ph.D. thesis, Laboratory for Machine Tools and Production Engineering (WZL) of RWTH Aachen, RWTH Aachen University, Aachen.
ISO 21771:2007,“Gears—Cylindrical involute gears and gear pairs—Concepts and geometry”.
VDI/VDE 2612:2018,“Messen und Prüfen von Verzahnungen”.
ISO/TR 10064 1:2019,“Code of inspection practice—Part 1: Measurement of cylindrical gear tooth flanks”.
DIN 867:1986,“Bezugsprofile für Evolventenverzahnungen an Stirnrädern (Zylinderrädern) für den allgemeinen Maschinenbau und den Schwermaschinenbau.”
Hück M., 1983,“Ein verbessertes Verfahren für die Auswertung von Treppenstufenversuchen,” Werkstattstech. 24, pp. 406–417.
Dixon W. J. and Mood A. M., 1948, “A Method for Obtaining and Analyzing Sensitivity Data,” J. Am. Stat. Assoc., Vol. 241 No. 43, pp. 109–126.
Printed with permission of the copyright holder, the American Gear Manufacturers Association, 1001 N. Fairfax Street, 5th Floor, Alexandria, Virginia 22314. Statements presented in this paper are those of the authors and may not represent the position or opinion of the American Gear Manufacturers Association.