Small reductions in friction can result in large savings in power requirements, particularly at high speed. Lowering the viscosity of lubricating oils helps, but there is a lower limit on lubricant viscosity where functionality in the application is retained. Nanocomposite thin-film coatings have been employed in various applications to reduce sliding friction and surface wear and are proposed for use in gear applications.
This work aims to demonstrate the potential benefit of applying nanocomposite coatings to gear teeth to reduce operating friction and wear by presenting tribological test data.
A brief history of thin film coating technology development history is given in the following paragraphs (Refs. 1, 2).
World War II Era
Optical Coatings: During World War II, the demand for improved optics led to advancements in optical coatings. Antireflective coatings, composed of thin films, were developed to enhance the performance of lenses and other optical devices.
Post-World War II
Thin-Film Deposition Techniques: In the post-war period, there was significant progress made in thin-film deposition techniques. Vacuum deposition methods emerged, such as Physical Vapor Deposition (PVD) and Chemical Vapor Deposition (CVD). These techniques enabled precise control over coating thickness, microstructure, and composition, laying the foundation for developing nanocomposite coatings.
1950s–1960s
Semiconductor Industry: The semiconductor industry’s growth in the 1950s and 1960s drove advancements in thin-film technology. Thin films became integral to the manufacturing of semiconductors, with techniques like sputtering and evaporation becoming widely adopted.
Plasma-Assisted Techniques: The use of plasmas to assist in thin-film deposition gained prominence in the 1970s and 1980s. Plasma-Assisted Chemical Vapor Deposition (PACVD) and Plasma Enhanced Chemical Vapor Deposition (PECVD) techniques were developed, improving thin film coatings’ mechanical and chemical properties and lowering processing temperatures.
Late 20th Century
Advancements in Coating Materials: Continued research led to the development of a wide range of coating materials. Thin films were now being applied not only for functional purposes like corrosion resistance and optical enhancement but also for novel applications in electronics, sensors, and medical devices.
Nanocomposite Coatings
Nanotechnology and Multifunctional Coatings: The 21st century has seen a convergence of nanotechnology and thin-film coatings. Nanocomposite coatings, with nanoscale materials embedded, have become a focus for enhanced properties. Multifunctional coatings have gained significant attention, offering a combination of properties such as self-cleaning, anti-bacterial, and enhanced mechanical properties.
United Protective Technologies, LLC (Ref. 3), has expanded the technology of thin film coatings by using custom-engineered reactors, along with low-temperature application strategies, to produce coatings that reduce friction. These coatings often reduce friction by more than 50 percent and increase wear resistance by orders of magnitude. The low process temperature used to apply these coatings means that the heat treatment done to most gears before placing them in service is not affected by this application process, allowing it to be the final production step before placing a component in service.
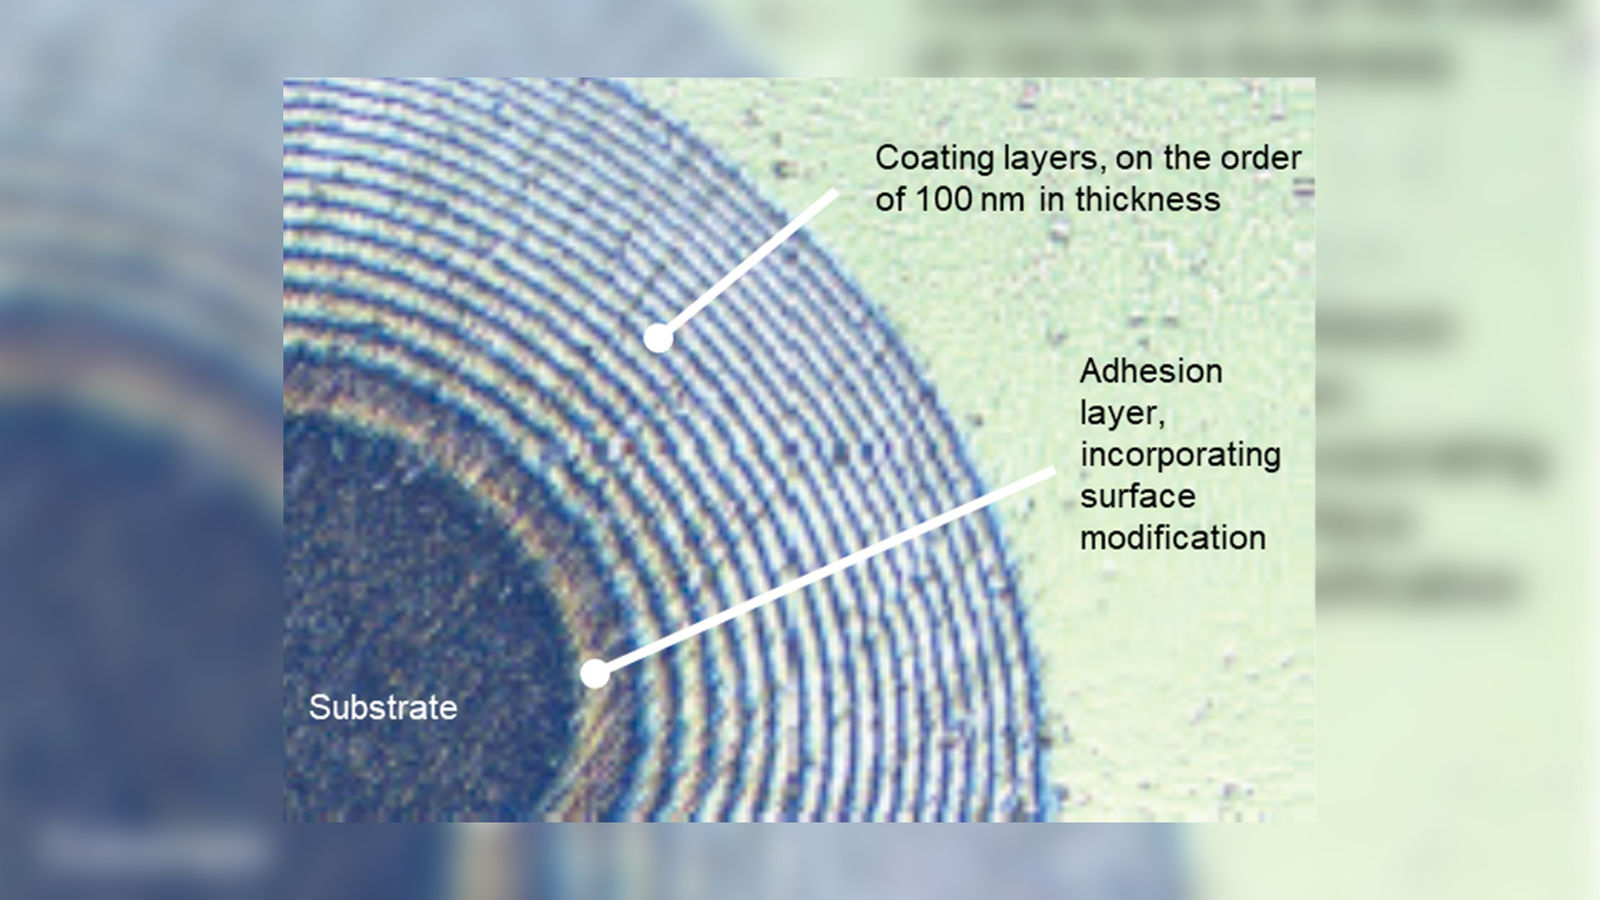
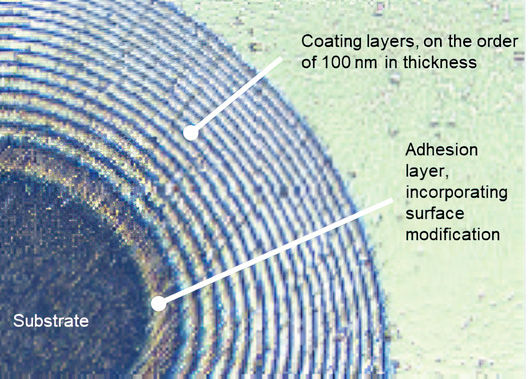
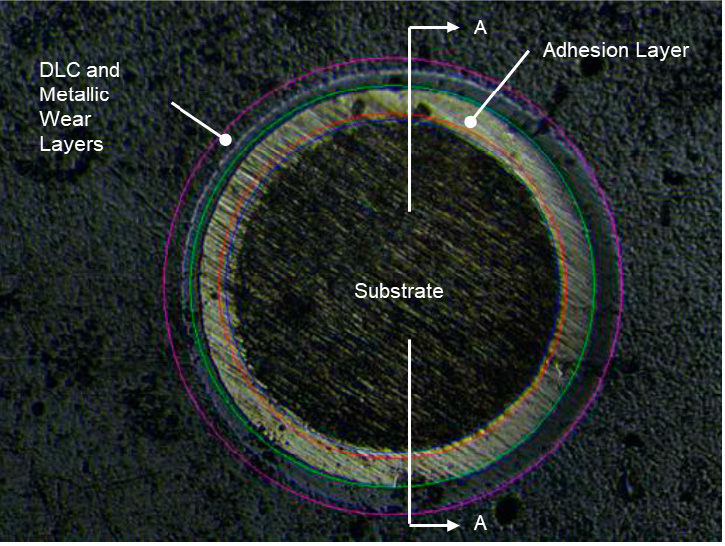
Figure 1 shows the basic structure of a nanocomposite coating. The image displayed shows the layered coating, adhesion layer, and substrate, revealed by the process described in ISO 26423 (Ref. 4). A 15 mm diameter steel ball, using diamond paste as an abrasive, is used to grind through the coating to expose a section used to make a thickness measurement. Different coating systems have different layers and can have different layer mechanical properties and chemical compositions.
Figure 1—Image of the features of a nanocomposite coating after performing the ISO 26423 coating thickness measurement procedure
Specific Coating System Parameters
The coating system studied in this work, United Protective Technologies P51M, is a nanocomposite coating system comprised of a metallic adhesion layer and multiple nanocomposite functional layers. Its applied thickness is 3–5 microns.
Application
This work was funded as an SBIR project (Ref. 5) entitled “Super Lubricity Interface Coatings (SLIC)”, under topic AF203-DCS01, and was formulated to study and improve the performance of aerospace service gears used in the J85 turbine engine deployed on T-38 aircraft, shown in Figure 2, in service with the US Air Force. The current coatings used on many high friction aircraft components are outdated, and due to the low temperature final stage deposition of the UPT coating item configuration can remain the same, allowing the Air Force an economically viable method of improving the properties of these key components. The T-38 aircraft continues to be the quintessential training jet in the Air Force fleet, however, with the T-7 Redhawk positioned to take its place the need to develop economically viable improvements are of key importance for keeping the aging fleet performing in the interim.
Figure 2—Air Force T-38 Talon, in flight (Ref. 6).
System Description
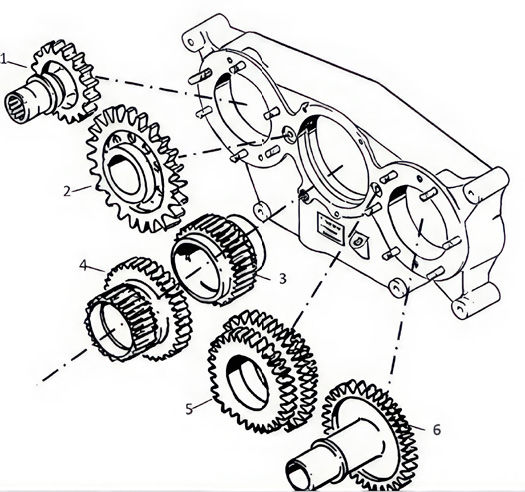
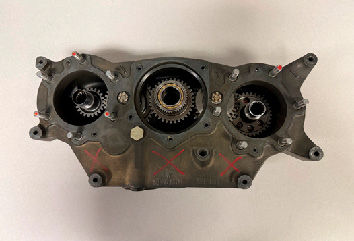
The gears are part of a gearbox assembly designed by Northrop NORAIR division in 1961, which pulls power from the main turbine shaft to drive hydraulics and provide electrical power to aircraft systems in flight. Due to the hydraulic pump and electrical generator needs, the gearbox utilizes an oil-based hydraulic/centrifugal mechanism to shift between a disk clutch and a sprag clutch for low-speed and high-speed conditions, respectively. Most gearboxes are produced through the repair and overhaul procedure, refurbishing and reusing key components, including all gears where possible.
Hardware Description
The gears are arranged in series, as shown in Figure 3, except for gears 3 and 4. The input shaft, being the central shaft for both Gears 3 and 4, transmits power from the engine to the rest of the gearbox through either Gear 3 or Gear 4, via the sprag clutch or the disk clutch, respectively, depending on the input speed. All are spur gears, with two gears being of compound configuration. The gears are manufactured from AISI 4620 or AISI 8620 steel, with AISI 8620 being preferred due to market demand and availability limitations. All testing for this project was performed with specimens manufactured from AISI 8620 steel, which was carburized and heat-treated per the gear drawings.
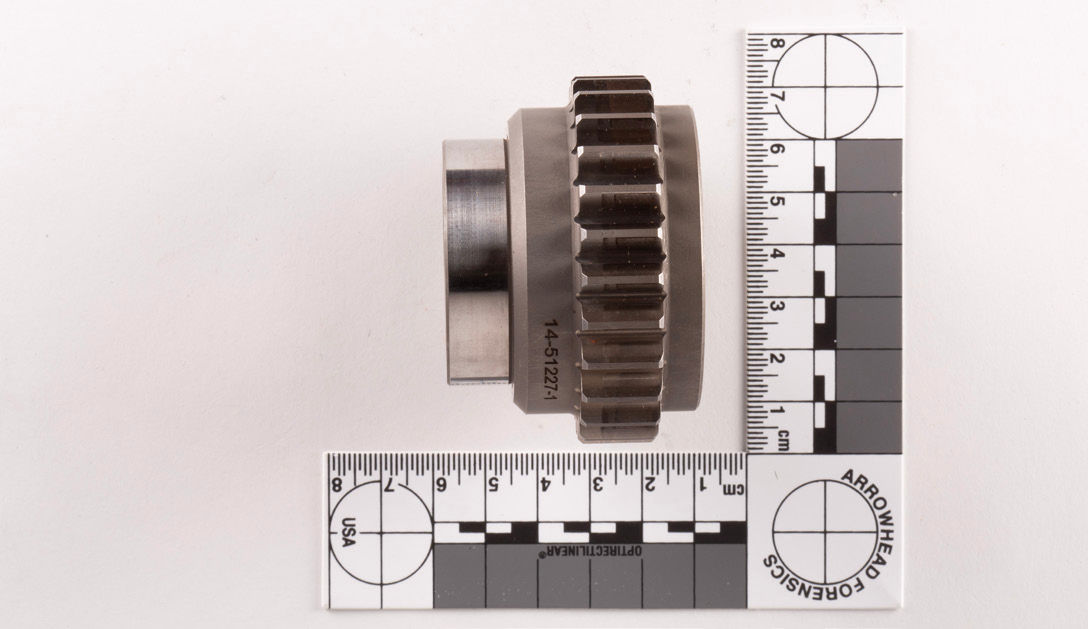
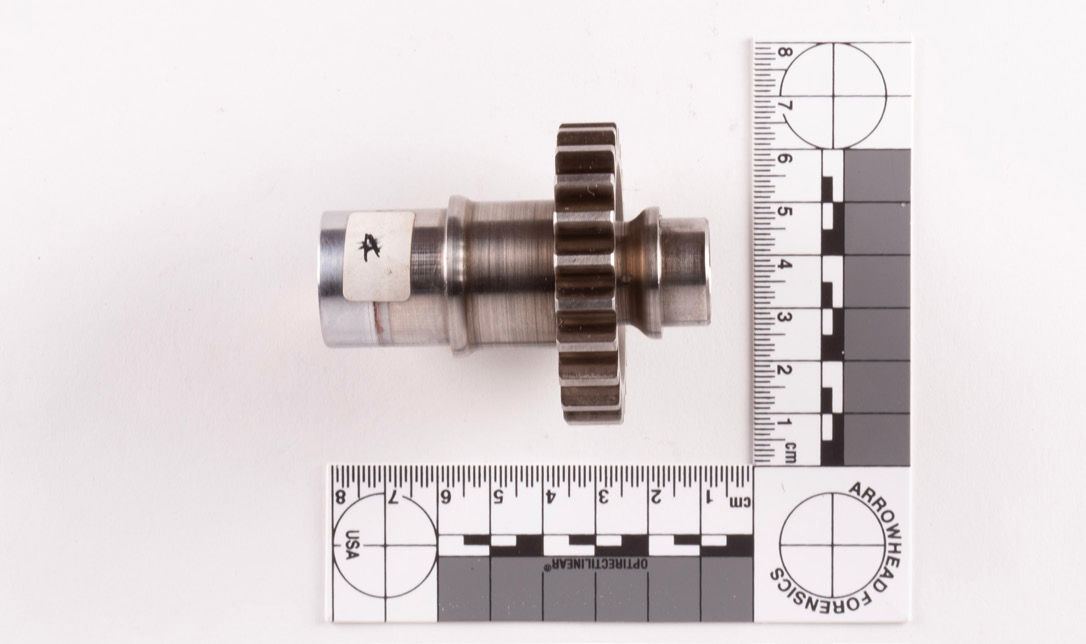
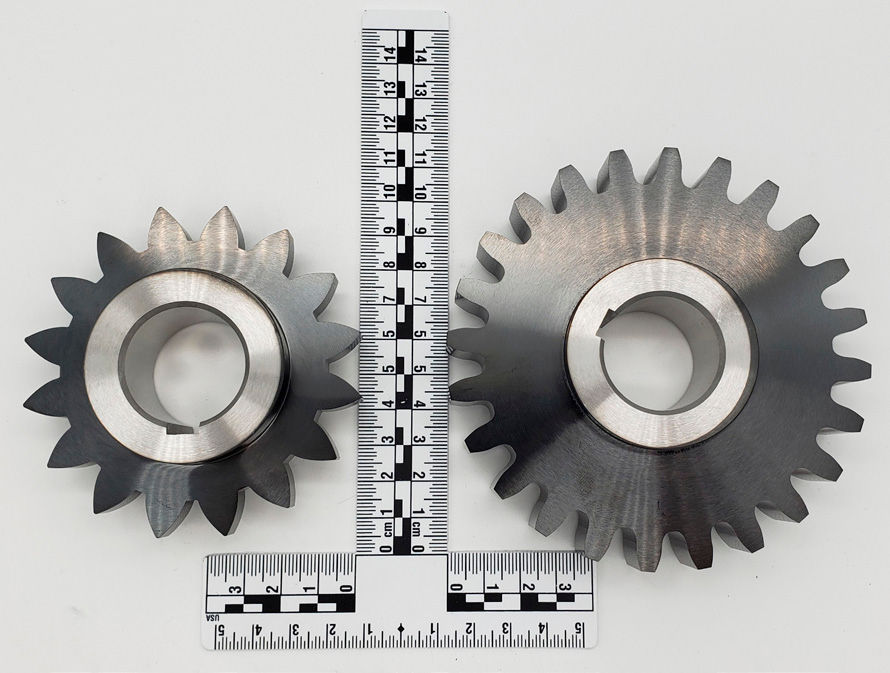
Figures 5-6 show selected gears, with scales for reference.
Figure 5—Sprag Clutch Gear (Gear #3) with scale for reference.Figure 6—Generator Spur Gear (Gear #1) with scale for reference.
[advertisement]
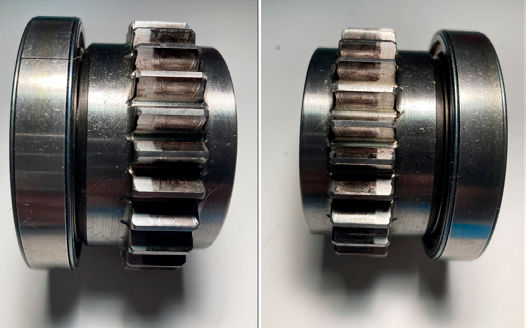
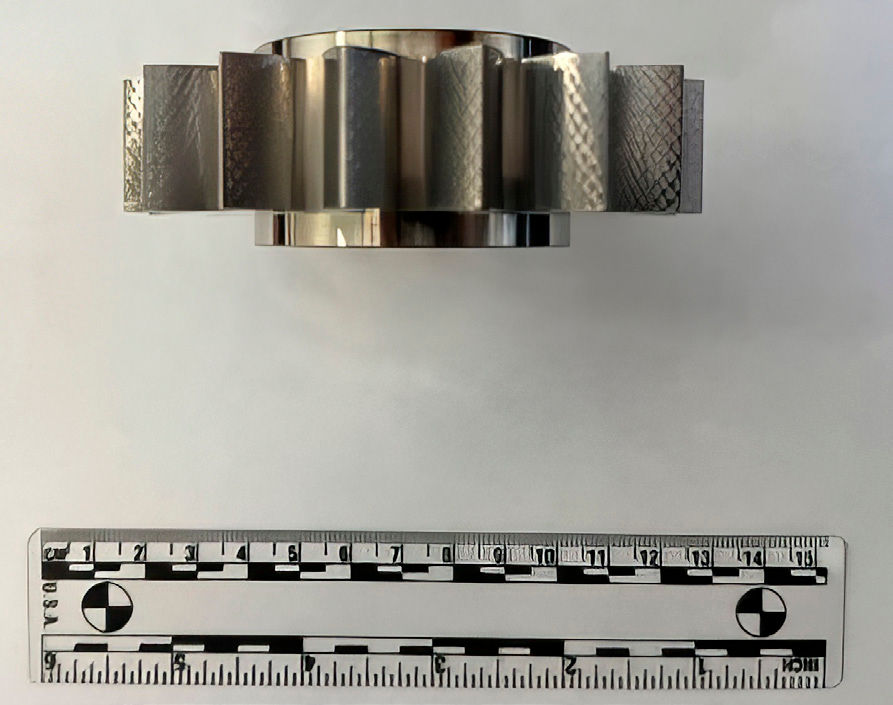
Figures 7-8 show the typical wear and damage seen on gears recovered during overhaul operations.
Figure 7—Sprag Clutch Gear (Gear #3) pictured with its support bearing in place.Figure 8—Generator Spur Gear (Gear #3) showing typical wear seen at overhaul.
Table 1 shows the gear connectivity.
Gear #
Nomenclature
1
Generator Spur Gear
2
Spur Idler Gear
3
Sprag Clutch Gear
4
Disk Clutch Gear
5A
Cluster Gear
5B
Cluster Gear
5C
Cluster Gear
6
Hydraulic Pump Gear
Table 1—Gear nomenclature.
Gear 5 is a compound gear with three different diameters. The three gear profiles can be seen on the drawing as A, B, and C. Track A has the smallest pitch diameter, Track B has the largest pitch diameter, and Track C has the intermediate pitch diameter. That naming convention has been preserved in this document.
Operating Parameters
The gears are lubricated with MIL-PRF-7808 turbine engine lubricating oil and run in a semi-submerged bath. This fluid is filtered and cooled such that the maximum operating temperature never exceeds 250°F. Contact stress was calculated as a first step in the analysis.
The AGMA equation used was of the form (Ref. 7):
(1)
Where Cp is an elastic matching parameter given by:
(2)
Where Wti> is the transmitted force, Kv is a stress concentration factor for the velocity of operation, Ko is a stress concentration factor for loading type, Ks is a stress concentration factor for gear tooth size, Km is a stress concentration factor for load distribution across the flank of the gear, Cf is a stress concentration factor for surface finish of the gear, F is the minimum width or flank of the gear tooth in the mesh pair, d is the pitch diameter of the pinion of the two gears in mesh (the gear with the smallest pitch diameter), and I is a geometry correction factor for the involute gear tooth shape, which for an external spur gear is given by Ref. 8:
(3)
Gear contact stress calculations for each gear pair at both input speeds assumed the following:
The 2,200 in-lbf input torque represented a transient load on the gear train. An overload factor of KO = 2.25 was applied to account for this loading profile.
All gears were carburized and heat-treated to a case hardness of 58–60 on the Rockwell C scale.
The factor modifying the bearing stress calculations based on potential misalignment (Km) was 1.03, assuming well-centered and well-supported gears.
Gear surface speed was calculated for each gear and used to generate factors in the equations as dictated by AGMA.
The geometry stress concentration factor was calculated using the gear pressure angle of 20 degrees, with individual gear pairs having discrete values for this factor.
The elastic matching factor assumed all gears were manufactured from AISI 4620/8620 steel.
The surface roughness factor (Cf) assumed all gear teeth in mesh had surface finishes of 32 microinch rms, yielding a roughness factor of 1.1.
Stresses were calculated based on the minimum gear flank in the mesh and the pitch diameter of the pinion of the two gears in the mesh.
The following results were obtained using the equation shown based on these assumptions. These results represent the maximum stresses present on gear flanks based on the shock load provided. All the results for contact stresses can be seen in the two tables below, one for each speed of operation supplied.
Gear #
Pinion #
Contact Stress (lbf/in2)
Contact Stress (MPa)
2
3
400.561E+3
2.762E+3
2
1
416.367E+3
2.871E+3
5B
3
434.178E+3
2.994E+3
6
5A
516.683E+3
3.563E+3
Table 2—Estimated maximum stress at high-speed operation.
Gear #
Pinion #
Contact Stress (lbf/in2)
Contact Stress (MPa)
2
3
393.689E+3
2.715E+3
2
1
410.460E+3
2.831E+3
4
5C
406.964E+3
2.807E+3
6
5A
511.135E+3
3.525E+3
Table 3—Estimated maximum stress at low-speed operation.
These results can be compared to the allowable bearing stress. The material constant is modified according to the following relationship:
(4)
where sac is the gear material’s constant allowable bearing stress, CH is a hardness ratio factor, KT is a stress concentration factor based on service temperature, and KR is a stress concentration factor based on desired reliability. SH is a safety factor.
We consider the following for values in this relationship:
The AGMA standard identifies the maximum bearing stress allowable for carburized, hardened steel gears as 275 x 103 psi (Grade 3 steel gears).
We assume that YN takes a value of unity, i.e., that the gears were designed for a life of 106 cycles, which is the standard approach.
For this analysis, we assume a safety factor of unity.
KT also takes a value of unity since the service temperature is less than or equal to 250°F.
KR takes a value of 0.68, as shown next.
The life expectancy of the gears in this device was 2,500 hours MTBF, with a replacement time of 2,250 hours. This can be converted to reliability (in percent) using the following Ref. 9:
(5)
This yields a reliability of 41 percent. The minimum reliability considered by AGMA is 50 percent, which produces a value for KR using:
(6)
This value is a bit more conservative than the value shown in Table 11 of Ref. 7. Using this stress concentration factor, our allowable stress for the gears under analysis would be 404 ksi. This calculated allowable stress value seems to be exceeded in six use cases. All the loads and contact stresses during in-house tribology tests were decided based on these calculations. According to the analysis, these gears exceeded the allowable contact stresses in six studied cases, as seen in Tables 2 and 3.
Testing Rationale
The failures reported for the gears under study indicate that there is surface interaction attributable to high friction and excessive sliding wear of meshing surfaces due to adhesion or localized failure of the gear material. The high stress present in the gear mesh suggested to the investigation team that a nanocomposite coating could benefit the system. A nanocomposite coating assists with wear and frictional performance. This may reduce interfacial temperature, leading to improved substrate and lubrication durability. Testing was undertaken to demonstrate the improved lubricity that the nanocomposite coating offers and its ability to improve wear resistance.
Coating Performance Testing
Standard tribological testing was performed on the coating as a gate for further, more extensive testing. Upon completion of tribological testing, two types of scuffing tests were undertaken to demonstrate the potential benefits to gear performance attainable by applying the coating under study.
Effect on Substrate Material Properties
Since this coating has not been widely applied to gears and has never been deployed on aerospace platforms, the project sponsor requested that coated parts be subjected to material property tests normally associated with lot acceptance of the gear substrate materials. By demonstrating success on this battery of tests, it could be demonstrated that the application of the coating does not affect key material properties deemed critical by designers.
The process of applying this coating system is done at relatively low temperatures, usually below 400°F. This allows the coating process to be the final production step for any treated gear, and the temperature exposure does not affect the heat treatment called for by the gear designer.
Test Methods and Results
Basic Tribological Testing
ASTM G133 (Ref. 10) is used as a coating evaluation test during development work. This test uses a ball-on-disc method, with a load imposed on the ball. The disc reciprocates, and the coefficient of friction is extracted from the force required to cycle the sliding element. This coating was tested with a coated disc (coupon), no lubrication, and a static load of 20 N applied to the interface. A tungsten carbide-coated ball of 6mm diameter was utilized for this test. This combination produced a contact stress of 320 ksi.
The apparatus cycled at 5 Hz (5.6 cm/s with a stroke length of 4 mm). This test was performed at 25°C, laboratory ambient temperature. The test was performed over a total interface travel of 1,000 m.
The results of the testing performed on the coated sample are compared to the results from testing using the bare substrate, with a surface finish equivalent to the value required for finished gears and the bare substrate with the recommended surface finish for applying the coating system. As discussed, the coefficient of dynamic friction is derived from the actuation forces necessary to produce motion. Additional metrics are gathered from the amount of wear present on both the coated test coupon and the test ball after the test.
Table 4 compares the performance of the substrate material and the coated substrate material. The coating tested had a total thickness of 3.5 μm. It is standard practice to recommend that surface finishes such as those achievable with isotropic superfinishing be specified in conjunction with applying thin film coatings to reduce friction and wear.
Surface Finish (μin, Ra)
Coefficient of Sliding Friction (μk)
Normalized Test Ball Wear (mm3/N/m)
Normalized Coupon Wear (mm3/N/m)
1
32†
0.70
3.31x10⁻⁷
2.15x10⁻⁶
2
4
0.60
1.58x10⁻⁷
9.40x10⁻⁷
3
4 Coated with P51M
0.15
2.56x10⁻⁹
8.92x10⁻⁸
Table 4—ASTM G133 test data for AISI 8620 test coupons in coated and uncoated conditions.
† This is the surface finish specified on the gear manufacturing drawings.
Coating Characterization Testing
Testing used to characterize the adhesion and resilience of thin film coatings was also employed during this work. In addition to the thickness measurement test described in paragraph 1.6, the tests described here compare different coatings and monitor the repeatability of the coating process.
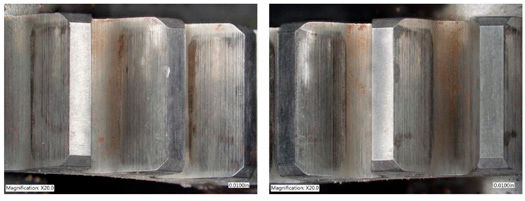
Figure 7 shows the result of a coating thickness test performed in accordance with ISO 26423, as discussed in reference to Figure 1. The coating thickness was optically measured to be 3.95 microns.
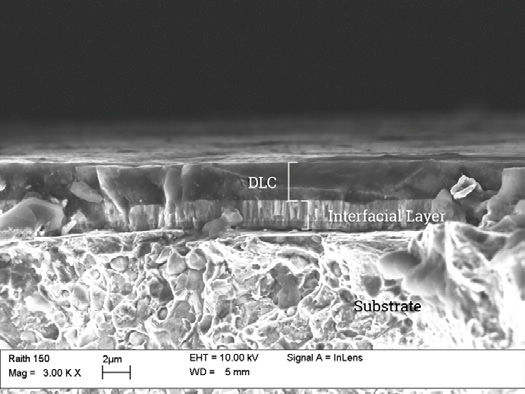
Figure 10 shows a section view, obtained with a scanning electron microscope, of the test crater illustrated in Figure 9.
Figure 9—ISO 26423 Thickness Test on the P51M coating system.Figure 10—ISO 26423 Thickness Test on the coating system. This image is oriented as Section A-A of Figure 7.
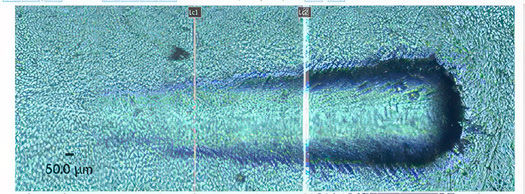
The test used to evaluate coating adhesion, ASTM C1624 (Ref. 11), uses a stylus with a constantly increasing load to quantitatively characterize the adhesion performance of a coating. The coating is tested with a Rockwell “C” style indenter, with the test terminating when the normal force reaches 100 N. Three critical loads are identified in the standard, representing different levels and types of coating failure. These loads are captured with the help of a machine vision system, identifying the coating failure mode. The first critical load (LC1) is the load where the coating begins to exhibit chevron cracking, indicative of cohesive coating failure or failure of the coating to adhere to itself. LC2 is said to occur when the coating exhibits chipping failure, indicative of an adhesive failure of the coating, or where the coating begins to spall away from the substrate at the edges of the damage zone. LC3 is the final metric, where the coating freely spalls away from the substrate. An image of the test impression is shown in Figure 11.
Figure 11—Image of ASTM C1624 Scratch Test results on P51M Coating. For this test, LC1 was detected at 33.3 N, LC2 was detected at 63.27 N, and no occurrence of LC3 was detected.
Mechanical Property Testing
Four different mechanical property tests were conducted on standard uncoated and coated specimens. The material used for testing was AISI 8620, which was machined and case-hardened to match the requirements shown on the gear drawings (HRC 60 and 0.010–0.020-in. case depth). An independent testing laboratory performed the mechanical property tests. The fluid contamination and thermal shock tests were performed in the laboratory facilities of the authors at UPT.
The following properties of the coated material were tested, using the test methods indicated in Table 5.
Mechanical Property
Test Method
Summary Result for Coated Parts
Tensile Strength
ASTM E8
7% average increase in tensile strength, 13% average increase in yield strength
Fatigue Strength
ASTM D790
8% average increase in number of cycles to failure
Shear Strength
ASTM B769
0.6% average increase in fracture strength
Compression Strength
ASTM E9
0.1% average increase in yield strength
Fluid Contamination
MIL-STD- 810G 504.2
No degradation
Thermal Shock
MIL-STD- 810G 504.2
No degradation
Table 5—Summary of mechanical property tests for coated test articles.
Please consult Ref. 12 for more details about test results.
Corrosion Resistance
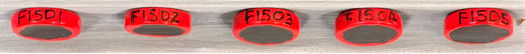
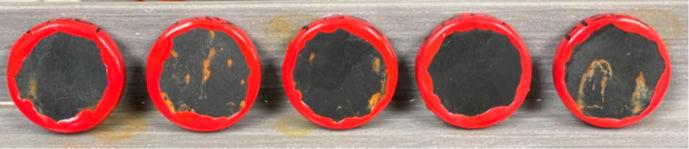
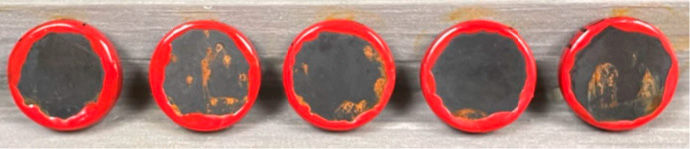
Coated coupons, manufactured from AISI 8620 steel and carburized to match the gear drawings’ specifications, were tested per MIL-STD-810G 509.6. This exposure to salt fog was accomplished in the author’s laboratory. Figure 12 shows the coupons prepared for testing with edge sealant applied. All test articles have the coating under analysis on the exposed test surface. Test coupons have 1 in. dia. with a thickness of 0.25 in.
Figure 13 shows the coupon test articles after 24 hours of exposure.
After the initial 24-hour exposure was complete, the test articles were returned to the chamber for an additional 24 hours (48-hour total exposure). The results of that test are shown in Figure 14.
Figure 12—Test coupons, showing the sample numbers.Figure 13—Test coupons from Figure 1 after 24 hours of salt fog exposure.Figure 14—Test coupons from Figure 1 after 48 hours of salt fog exposure.
Normal testing is terminated after 48 hours of exposure in the procedure defined in MIL-STD-810G 509.6. The coupons that showed corrosion were analyzed under magnification. The corrosion present was attributed to holidays/pinholes (Ref. 13) in the coating, which can occur when the surface preparation for the material is inappropriate, when the coating application process is not fully developed, or when the adhesion layer and associated surface modification design are not fully tailored to the chemistry of the substrate. The coupons that did not show signs of corrosion were returned to the salt fog chamber for long-term exposure.
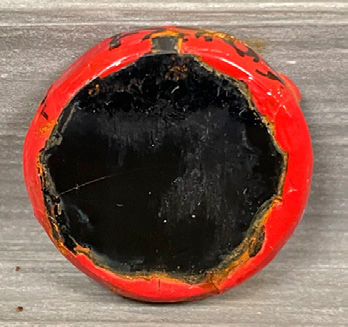
Subsequent development of the adhesion layer and surface modification used with this coating recipe has yielded significant, consistent corrosion resistance performance for the coating system. Figure 15 shows a coupon manufactured from AISI 4140 steel. This coupon was removed from long-term testing to clear the chamber for new work. Based on the latest test results, the coating is rated for 1,000+ hours of salt fog exposure.
Figure 15—Test coupon F2703 after 1,341 hours of salt fog exposure.
Shifted Profile Gear Scuffing Test
To translate the performance exhibited by the coating system under evaluation to a more application-specific test environment, methods used to evaluate liquid lubricants were explored. Shifted profile scuffing testing is commonly used to rate and compare liquid lubricants used in gear applications. The standard test, defined by ASTM D5182–Evaluating the Scuffing Load Capacity of Oils (FZG Visual Method) (Ref. 14), uses specially designed test gears manufactured from 20MnCr5 alloy (UNS G51200) steel. These gears have a shifted profile to increase the amount of slip at the mesh interface. The gears run in a four-square, dual-shaft arrangement, with ever-increasing torque loading applied through an adjustable clutch in progressive test stages. The test operator evaluates the scuffing wear on tooth surfaces and stops the test when there is a total scuffing area on the gear equivalent to a single flank width. Gears are also weighed before testing so that a material loss figure can be provided at the end of the test. Figure 16 shows a commercially available test machine with standard test gears mounted.
Figure 16—Open test cell in a standard FZG-type test machine, shown with a standard set of test articles with equal flank widths. The gear wheel has 24 teeth, and the pinion has 16 teeth (Ref. 15).
This setup uses the pinion as the drive input for the system. Previous experience and analysis of the results of tribological testing indicated that a more severe test was appropriate if coating failure was to be observed. A more severe version of this test is defined in ISO 14635-2: FZG test procedures Part 2: FZG step load test A10/16, 6R/120 for relative scuffing load-carrying capacity of high EP oils (Ref. 16). In this test, the gear wheel drives the system in reverse. Additionally, the pinion has a flank width of 10 mm (half of the gear wheel flank dimension), increasing the contact stress between the test articles. The independent test lab performing this work suggested that Mobil DTE Light Oil of ISO grade 32 (Ref. 17) be used as a test lubricant, as it would offer minimal protection to the gear surfaces themselves, minimizing any occlusion of results attributable to the coating. This is the test that was performed to evaluate the scuffing performance of the coating.
While the test gears were manufactured from 20MnCr5 alloy (UNS G51200) steel, the coating’s adhesion performance is transferable to any ferrous substrate. The adhesion layer of the nanocomposite coating is not as sensitive to metallic substrate chemistry as it is to surface cleanliness. Additionally, the coating’s adhesion performance improves as surface hardness rises due to the decrease in substrate deformation.
Figure 17 shows a set of test gears after application of the coating. Figure 18 shows a close-up of the test surfaces of an uncoated gear, with the checked pattern visible. This is a visual aid for the test operator when assessing failure. Due to the small coating thickness, this pattern was still visible after coating application.
Figure 17—FZG test gears with P51M coating applied.Figure 18—FZG test gear view of flanks showing the checked pattern used to highlight the appearance of surface scratches.
Test results were reported in stages, given in Table 6. The lubricant bath temperature is also recorded to give information about the amount of heat generated at the mesh interface.
Test Stage
Operator Description
Calculated Contact Stress (MPa)
Calculated Contact Stress (ksi)
Oil Bath Temperature (°C)
1
No scratches on any teeth
206
30
40
2
No scratches on any teeth
417
60
40
3
No scratches on any teeth
670
97
50
4
No scratches on any teeth
878
127
120
5
No scratches on any teeth
1,093
159
125
6
No scratches on any teeth
1,314
191
125
7
No scratches on any teeth
1,527
221
125
8
No scratches on any teeth
1,730
251
130
9
No scratches on any teeth
1,960
284
130
10
Two teeth with two scratches each
2,176
316
135
11
Scratches on six teeth
2397
348
145
12
Scratches on all teeth
2,615
379
151
13
Failed, Sum of heavy scuffing on all teeth > 1 flank width
2,833
411
172
Table 6—ISO 14635 - 2 FZG test procedures Part 2: FZG step load test A10/16, 6R/120 for relative scuffing load-carrying capacity of high EP oils results for P51M. 1.4 Liters of oil were used for this test.
The failure stress is far more than the maximum allowable stress for grade 3 steel gears given in Ref. 7, of 275 ksi.
The pinion and gear wheel were weighed before and after the test. Table 7 summarizes the material loss due to scuffing because of this test.
Weight prior to testing (g)
Weight after testing (g)
Weight Loss (g)
Weight Loss (ppm)
Gear Wheel
1,258.6196
1,258.0063
0.6133
487
Pinion
708.1166
707.9748
0.1418
200
Table 7—ISO 14635 test weight change data.
Ball on Disc Scuffing Test
Additional testing was done with an alternate method. A ball-on-disc method was employed to better control the contact surfaces’ relative velocity. This test allows the user to specify the amount of sliding present at the contact interface where both sliding and rolling occur. In involute gear teeth, the contact is perfect rolling at the pitch diameter, with varying amounts of sliding in the rolling direction and in contrast to the rolling direction during every tooth contact event. A commercially available ball-on-disc scuffing test cell is shown in Figure 19.
Figure 19—Commercially available ball on disc test cell (Ref. 18).
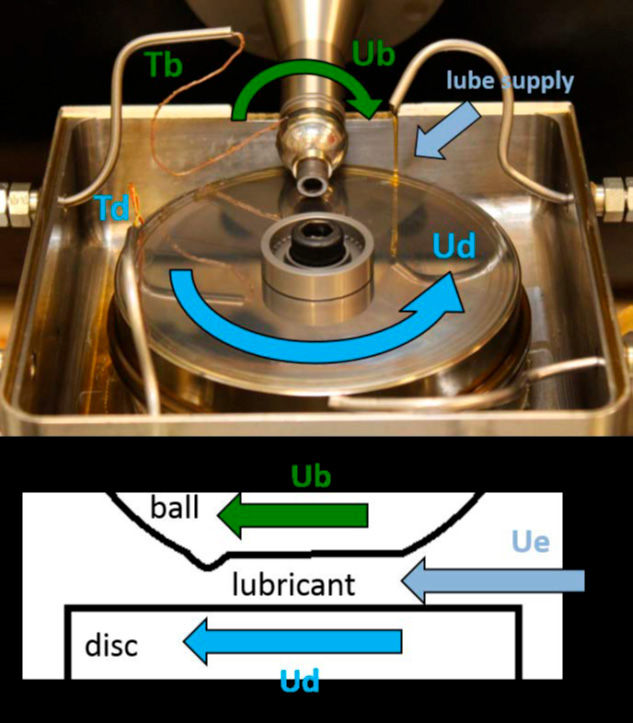
The use of this apparatus also allows control over the surface finishes of the two surfaces in contact to more closely match the interface expected on gears treated with the coating system. The test parameters were the entraining velocity (Ue), the sliding velocity (Us), and the velocity vector (v). These are defined by:
(7)
Where Ub is the velocity of the ball and Ud is the velocity of the disc, and
(8)
The velocity vector is the resultant vector sum of the ball and disc velocities:
(9)
Figure 20 provides a general schematic of the various velocities. Tb and Td refer to the temperatures of the ball and disc test articles, which are also shown in the data plots presented.
The velocities used in testing were chosen as representative of the general gear geometry under study in this work. The test progresses much as does the shifted profile test. Increasing loads normal to the test surface are applied to the test articles, with the occurrence of scuffing events used to terminate a test. To more closely simulate service conditions, MIL-PRF-7808 fluid was used as the lubricant for this testing. This test was accomplished by an independent testing laboratory.
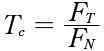
This test device monitors the traction coefficient, defined as:
(10)
where FT is the traction force, and FN is the normal force. This coefficient spikes sharply when the test articles begin to scuff due to dramatically increased friction between the moving surfaces, and this signal is used to terminate testing.
Figure 20—Schematic of forces in ball on disc testing (Ref. 19).
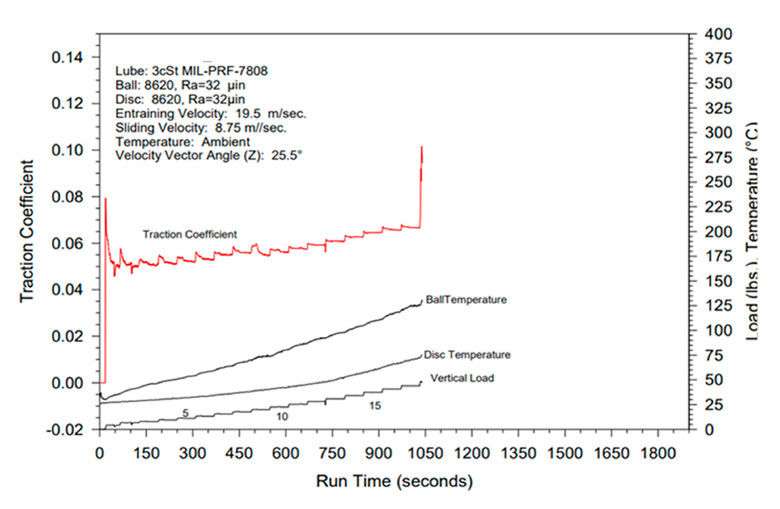
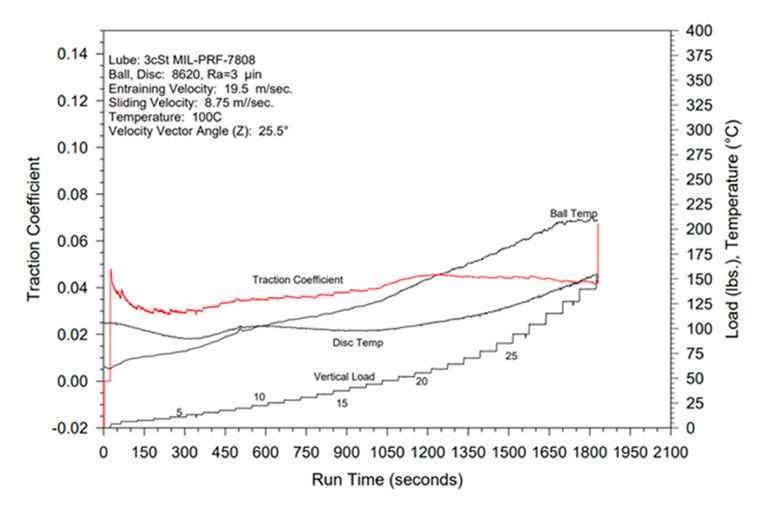
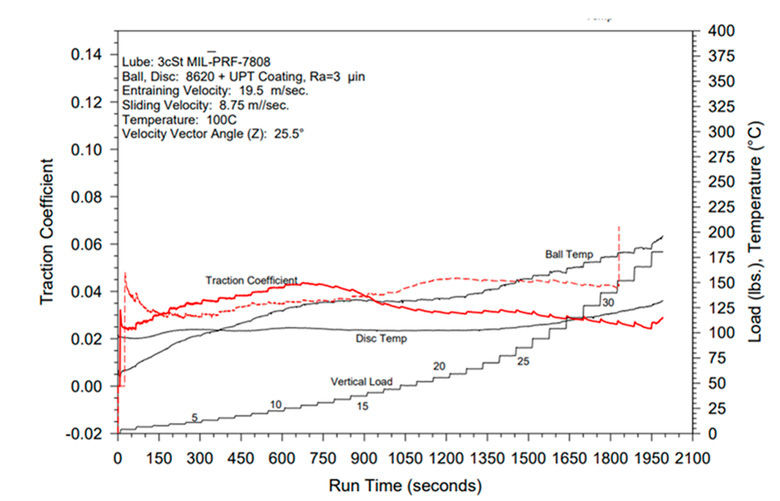
Table 8 provides test configurations and results for the various combinations of surface treatments evaluated. Figures 21–23 plot the test data.
Ball Surface Finish (μin, Ra)
Disc Surface Finish (μin, Ra)
Entraining Velocity (m/s)
Sliding Velocity (m/s)
Velocity Vector Angle (degree)
Failure Stage
Contact Stress (ksi)
1
32
32
19.5
8.75
25.5
18
241
2
3
3
19.5
8.75
25.5
30
345
3
3 Coated with P51M
3 Coated with P51M
19.5
8.75
25.5
33
372
Table 8—Ball On disc test configurations and test results. All test articles were manufactured from AISI 8620 steel.
Note that this test apparatus can monitor the temperature of both the ball and disc under test. The data for individual test cases are shown in Figures 19, 20 and 21.
The differences illustrated in Figure 21 are the reduction in traction coefficient, reduction in ball and disc temperatures, and the higher load capacity when comparing the test articles with an improved surface finish and test articles with both an improved surface finish and the coating system applied. At stage 30, these are 0.04 compared to 0.02 for the traction coefficient, 225°C compared to 175°C for the ball, and 150 °C compared to 120°C for the disc. The load capacity increased from stage 30 to stage 33. The increase in contact stress is shown in Table 8.
Figure 21—Data plot for the uncoated and unimproved surface finish ball on disc test articles with surface finishes representative of the gears under study.Figure 22—Data plot for the uncoated ball on disc test of test articles with improved surface finish.Note the scuffing event indicated by the traction coefficient data-trace at around t = 1,800 s.Figure 23—Data plot for the ball on disc test of P51M coated test articles. Note the lack of a spike in the traction coefficient. The red dotted trace is the traction coefficient of the uncoated ball on disc test, shown for reference.
Discussion and Future Work
The low coefficient of friction, improved wear resistance, and enhanced scuffing resistance exhibited by test articles treated with the nanocomposite coating under study indicate that further development is warranted. Improvement in wear resistance by multiple orders of magnitude, along with the drastic reduction in coefficient of friction, should yield significant benefits to many systems where gears are used. These laboratory results are compelling, but a demonstration in a testable application where the performance improvements of a system can be discerned will be necessary to achieve the level of confidence necessary to field this coating on a production basis.
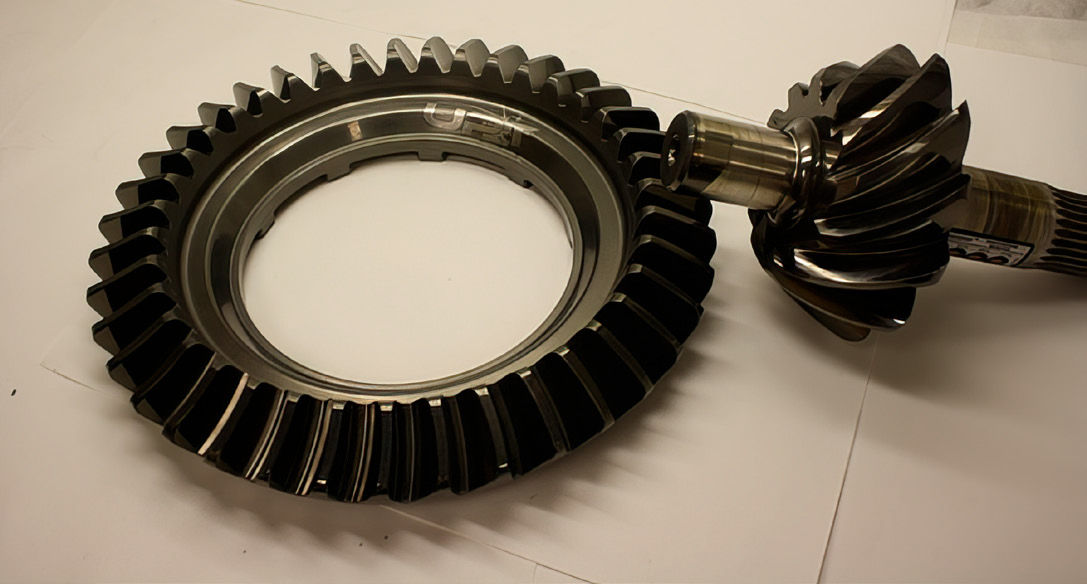
This project was inspired by work done for a competitive racing team operating in an environment where any edge in performance is valuable and where significant engineering effort is expended to obtain such performance advantages. The ring and pinion for this project are shown in Figure 24. It should also be noted that a similar arrangement is being developed for UAV applications.
Figure 24—Ring gear and pinion from a competitive racing team, coated with the predecessor of the P51M coating system.
While the authors are constrained by a non-disclosure agreement with this racing team to release detailed data, the results obtained from dynamometer testing showed an average increase of 0.5 percent of operating torque available at the vehicle brake.
Conclusion
Nanocomposite coatings have been shown to be potentially beneficial to gear applications. The benefits of using these coatings are:
Increased load capacity
Decreased temperature of operation
Corrosion resistance
Retention of heat treatment state after coating
Reduced friction between surfaces in mesh
References
C. Donnet and A. Erdimir, Tribology of Diamond-like Carbon Films: Fundamentals and Applications, New York: Springer, 2008.
S. Zhang and N. Ali, Nanocomposite Thin Films and Coatings: Processing, Properties and Performance, London: Imperial College Press, 2008.
United Protective Technologies, LLC, “United Protective Technologies,” [Online]. Available: https://www.upt-usa.com/ [Accessed 21 August 2024].
ISO, ISO 26423–Fine ceramics (advanced ceramics, advanced technical ceramics): Determination of coating thickness by the crater-grinding method, Geneva: International Organization for Standardization, 2009.
United States Government Small Business Administration, “America’s Seed Fund - SBIR STTR,” [Online]. Available: https://www.sbir.gov/ [Accessed 16 May 2024].
AGMA, ANSI / AGMA 2001–Fundamental Rating Factors And Calculation Methods For Involute Spur And Helical Gear Teeth, Alexandria: American Gear Manufacturer’s Association, 2004.
R. G. Budynas and J. K. Nisbett, Shigley’s Mechanical Engineering Design, New York: McGraw Hill, 2020.
C. Maiorano, E. Pascale, F. Shekelberg, L. Bouillaut and P. Sannino, “MTBF (Metric That Betrays Folk),” in 29th European Safety and Reliability Conference, Hannover, 2019.
ATSM, ASTM G133–Standard Test Method For Linearly Reciprocating Ball-On-Flat Sliding Wear, West Conshohocken, PA: ASTM International, 2022.
ASTM, ASTM C1624–Standard Test Method for Adhesion Strength and Mechanical Failure Modes of Ceramic Coatings by Quantitative Single Point Scratch Testing, West Conshohocken, PA: ASTM International, 2005.
P. Schmidt, T. Simmons and M. Kaushal, “Nanocomposite Coatings for Gears,” in American Gear Manufacturer’s Association Fall Technical Meeting, Chicago, 2024.
Garrett, Johansen, Orlandić, Bashir and Raeissi, “Detecting Pinholes in Coatings with Hyperspectral Imaging,” in 11th Workshop on Hyperspectral Imaging and Signal Processing: Evolution in Remote Sensing (WHISPERS), Amsterdam, 2021.
ASTM, ASTM D5182 Standard Test Method for Evaluating the Scuffing Load Capacity of Oils (FZG Visual Method), West Conshoshoken PA: American Society for Testing and Materials, 2019.
ISO, ISO 14635 - FZG test procedures Part 2: FZG step load test A10/16, 6R/120 for relative scuffing load-carrying capacity of high EP oils, Geneva: International Organization for Standardization, 2023.
US Army Research Laboratory, “Ball-on-Disc Tribometer’s Protocol Development: Loss of Lubrication Evaluation ARL TR 7588,” Defense Technical Information Center (DTIC), Aberdeen Proving Ground, 2016.
A version of this paper was first presented at the 2024 Fall Technical Meeting (FTM), October 7–9, 2024, Rosemont, IL. Printed with permission of the author(s). Statements presented in this paper are those of the author(s) and may not represent the position or opinion of the American Gear Manufacturers Association.