Optical vs. Tactile Gear Measurement for E-Mobility
A practical comparison of fringe projection and conventional tactile systems for classic and waviness gear characteristics
The use of electric drives seems to be a promising solution due to their high efficiency and optimized driving dynamics. However, they receive special attention in terms of noise behavior, as the engine noise of a combustion engine is no longer present. This can have a big impact on user comfort, especially at low speeds. The noise level of gears is, among other things, influenced by their design and manufacturing process. For this reason, in addition to the already established gear parameters evaluation, features are also tested that provide indications of possible frequencies from the manufacturing process that can lead to noise during operation. In addition to frequency testing in its spectrum and amplitude, the analysis of the topography of the tooth flank surface is becoming increasingly important. Surface analysis using waviness parameters is an important tool for understanding the causes of noise generation. For this purpose, it is necessary to measure the tooth flanks in several measuring planes in profile and helix direction. This type of measurement is currently mostly carried out with tactile measuring systems, which can lead to long measurement times, depending on the design parameters of the gear. In this project, a practical measurement comparison of conventional tactile and optical systems was done. The goal was to investigate if and how good the measurement results of classic characteristics and waviness characteristics of the different physical measurement principles are comparable. In addition, it was determined whether the use of optical fringe projection measurement systems is suitable for gear metrology.
Project Overview and Task Description
Conventional measurements with tactile systems are time-consuming and provide limited information about the surface quality of a gear. Optical measurements enable a supposedly more comprehensive information base to establish a correlation with the noise, vibration, and harshness (NVH) behavior of the tooth flank. To evaluate an optical measurement system for measuring the entire tooth flank surface and correlating the surface properties with the NVH behavior, two Centers of Competence (CoCs) of Robert Bosch GmbH have joined forces. The CoCs Optical and Non-Destructive Metrology (OND) and the CoC Gear Set Manufacturing (GSM) have been working on this two-year project (StraTec 23-036 Optical Gear Quality Evaluation) since January 2023. As part of the first phase of the project, extensive research was carried out in digital information sources as well as in scientific literature. In addition, expert interviews were conducted, and selection criteria for potential systems and providers with potential were defined. Due to the initial identification of ten small and large companies as well as research institutes, a reduction in effort was made by selecting six candidates for initial test measurements. At the beginning of 2024, the project had to be discontinued by Robert Bosch GmbH. Of the six selected candidates, only two had begun intensive investigations on a specified measurement object by this time. The tactile measurement data provided by Zeiss correlated very well with internal tactile measurement results. Zeiss signaled its willingness to continue the optical comparison measurements even after the project had been stopped, which resulted in this joint report.
A gear pump (hereinafter referred to as Bosch-Shaft) was chosen as the object of study, which was manufactured by means of a continuous generating grinding process. In the selection of the study object, properties were deliberately considered to pose a challenge for optical measurement methods, both from the literature and from in-house experience. These include reflections of the tooth flank surface and limited accessibility, especially in the protuberance area of the gearing. For a full capture of a tooth with optical measuring systems, several measuring positions are necessary (stitching), which means additional potential measurement uncertainty contributions.
Description
Symbol
Value
Number of teeth
z
12
Normal module
mn
≈ 3 mm
Facewidth
b
30 mm
Profile shift
x ⋅ mn
≈ 0,75 mm
Normal pressure angle
αn
≈ 20,0°
Helix angle
β
0°
Reference diameter
d
36,0 mm
Table 1—Geometry data of the Bosch-Shaft.
For the comparison measurements, a spur gear was used. Due to the profile shift and the protuberance, this gear already represents a medium to difficult accessibility for optical measuring systems and was evaluated as a suitable study object. The geometry data of the gear can be found in Table 1.
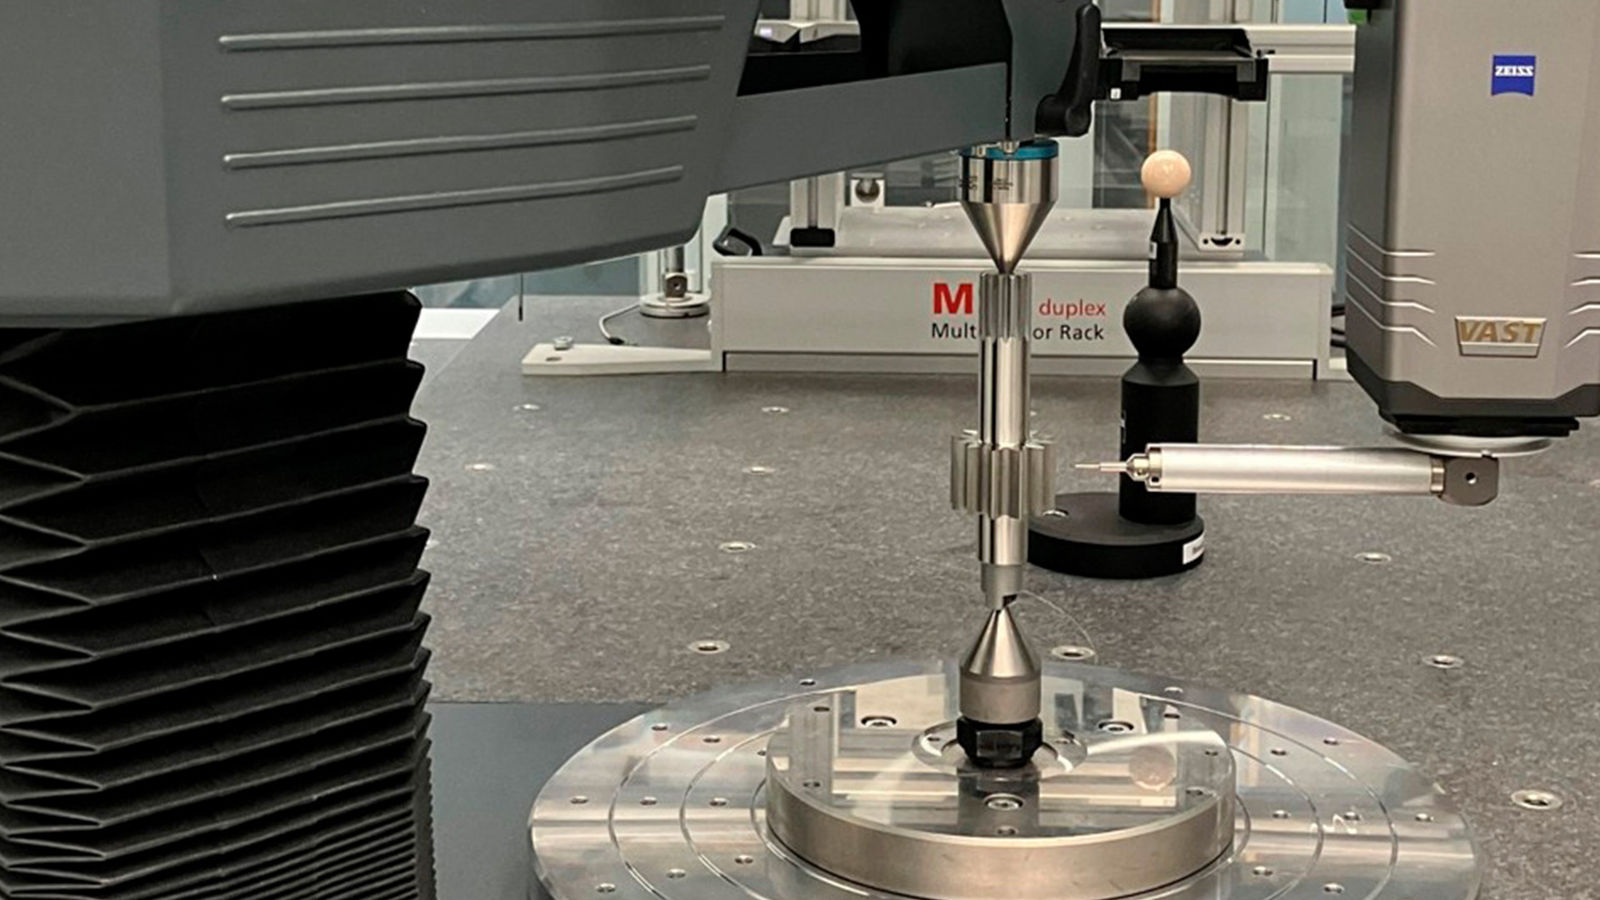
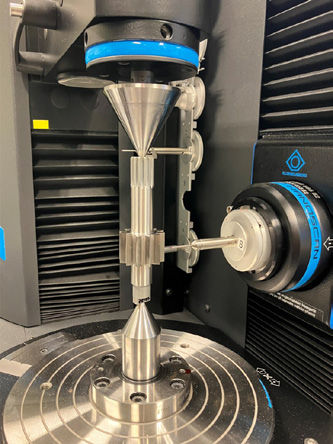
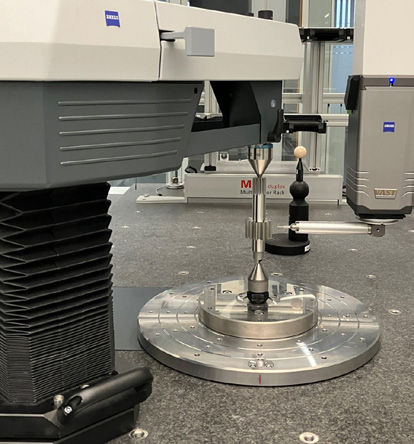
To ensure comparability with the results, a detailed task description was created. This includes all relevant aspects such as the definition of the reference elements and the reference system, the number of measuring points, the filter settings, as well as the relevant characteristics and tolerances. Two tactile measuring systems from different manufacturers and an optical measuring system were used for comparison measurements. The tactile measuring systems used were a Klingelnberg P40 gear measuring instrument (GMI) (Ref. 1), available at Bosch (test setup see Figure 1), and a Zeiss Prismo Verity coordinate measuring machine (CMM) with tailstock (Ref. 1) (test setup see Figure 2). As a representative non-contact optical measuring system, a Zeiss Atos Q fringe projector was used in a Zeiss ScanBox 4105 (test setup see Figure 3).
The procedure for the comparison measurements was divided into two steps. In step 1, a tactile system comparison of the existing Klingelnberg GMI with a Zeiss CMM was carried out. This comparison served firstly to validate the tactile measurement results obtained by the Klingelnberg GMI with the tactile measurement results obtained from the Zeiss CMM and, secondly, forms the basis of the measurement and evaluation strategy for the non-contact optical measurement system from Zeiss. In the following chapters, the measurement results are divided into two main blocks: Classic characteristics and waviness characteristics. Classic characteristics refer to all determined characteristics according to ISO 1328-1:2013-09; for better presentation, the individual characteristics have been summarized in the main categories profile, helix, pitch, and runout. In addition, depending on the workpiece, tooth thickness values such as spanwidth and measurement over two balls were compared with each other. Waviness characteristics are understood to be the orders with the corresponding amplitude (O/a), determined from the order spectrum using the compensating sine method (Ref. 2) and the helix angle of waviness (βw) (Ref. 3). The measurement results presented in the following chapters result from several repeatability measurements per measuring system. At least ten repeatability measurements were carried out and compared with each other according to the mean value per characteristic and system.
Bosch-Shaft Tactile System Validation
The measurement scope on the Bosch-Shaft with twelve teeth included an all-tooth measurement of all profiles and helices, including the pitch and runout measurement (or extraction of the pitch points from the profile data), as well as the measurement of tip and root circles on all teeth. In addition, one tooth was measured topographically with twenty-one profile sections.
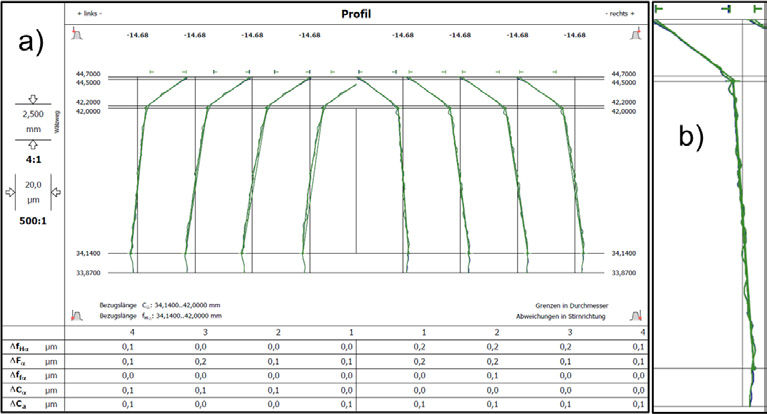
In the first step, the tactile measurement results of the Klingelnberg P40 were compared with those of the Zeiss Prismo verity. For a better visual and numerical comparison of the measurement data, the function actual-actual comparison (Ref. 4) of the Zeiss Gear Pro involute gear metrology software was used. Figure 4a shows the actual-actual comparison data as an example for the classic characteristic profile for the measurement data of Klingelnberg P40 (green) and Zeiss Prismo verity (blue). The color coding is retained throughout the report. Even when the results are greatly enlarged and exaggerated, the very good comparability of the measurement data of both tactile measuring systems can be seen in Figure 4b.
Figure 4—Actual-actual comparison profile Bosch-Shaft Tactile: a) overview and b) enlarged.
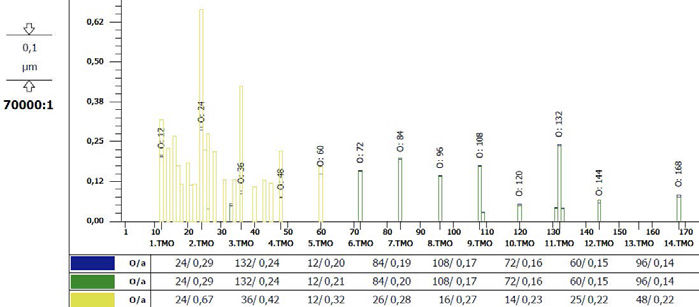
In the table of Figure 4a, the numerical differences (Δ) of the individual characteristics are shown. For all determined characteristics of profile and helix the differences are Δ < 0.5 μm. In the determined characteristics of pitch, runout, and spanwidth, the respective differences are Δ < 1.5 μm.
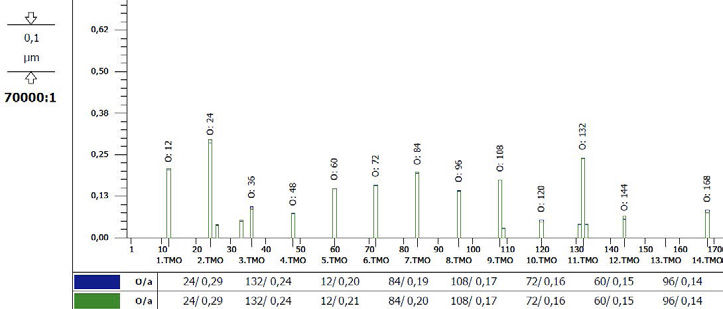
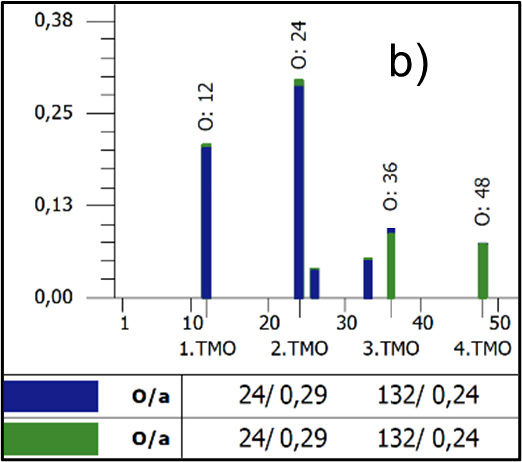
Figure 5a shows the actual-actual comparison for the waviness characteristic order spectrum as an example of the profile measurement data. Figure 5b shows the very good comparability of the tactile measuring systems, which is enlarged and highlighted in color. The differences Δ are also visible in numerical form on the measurement report and were in the range Δ < 20 nm.
Figure 5—Actual-actual comparison order spectrum profile Bosch-Shaft Tactile: a) overview and b) enlarged.
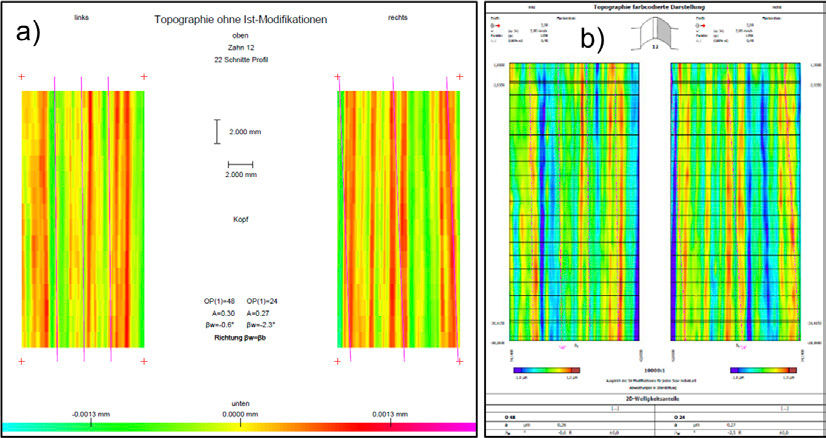
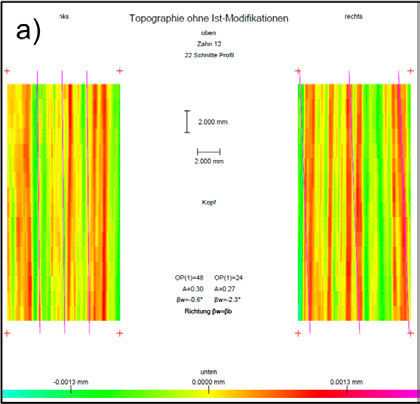
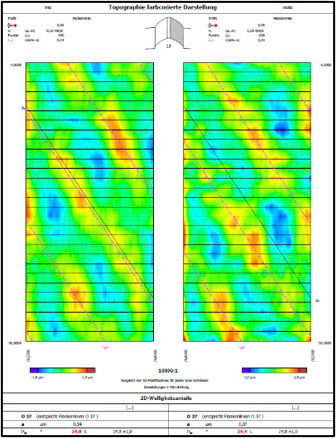
The actual-actual comparison is not suitable for comparing the waviness characteristic helix angle of waviness (βw). For this purpose, the respective measurement reports of the color-coded topography by Zeiss and Klingelnberg were visually compared with each other. The differences Δ of the determined helix angles of waviness were in the range Δ < 0.5° (Figure 6).
Figure 6—Color-coded topography Bosch-Shaft Tactile: a) Klingelnberg P40 and b) Zeiss Prismo verity.
Bosch-Shaft Tactile/Optical Comparison
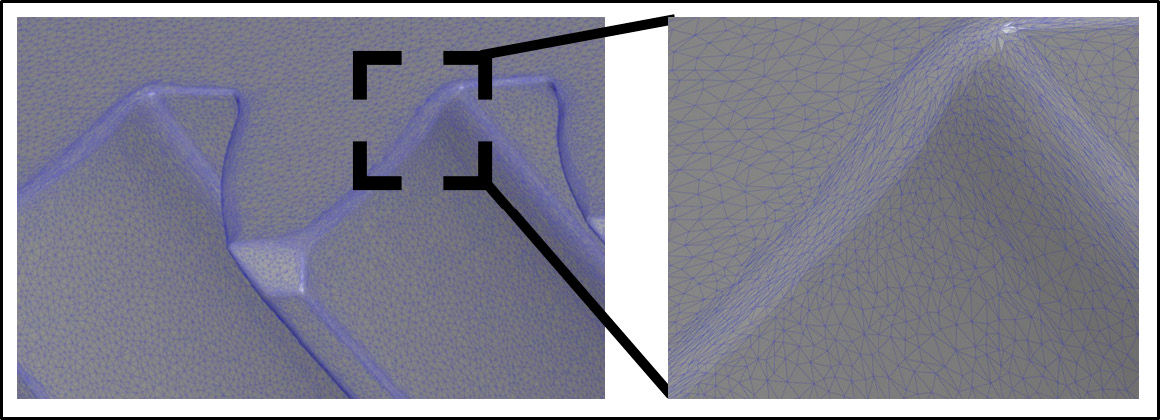
The physical measuring principle of fringe projection is fundamentally different from the tactile measuring principle. The physical limitations and special topics of optical measurement methods were discussed in detail in VDI Report No. 2393, 2021 (Ref. 5). The very good comparability of the tactile measurement results from section 2 was classified as sufficiently accurate for the system validation. The measurement and evaluation strategy of Zeiss Prismo verity was thus defined as the basis for the evaluations with Zeiss Atos Q. The special feature of the Gear Pro involute gear metrology software from Zeiss is that the same measurement program can be used for the evaluation of non-contact measurement data in STL format as for tactile measurement. This offers the advantage that, despite the different physical measurement principles, no further uncertainty contribution regarding the measurement strategy must be considered. In principle, however, as shown in Ref. 5, various restrictions must be observed for a high-quality measurement. The following relevant points are to be mentioned as examples: spraying-in of the surface to minimize reflections; ensuring accessibility in areas that are difficult for optical systems, such as the tooth root or the transition area to the protuberance; and sufficiently high point density to minimize the influence of polygonization (merge individual scans into a final mesh), see Figure 7.
Figure 7—Measurement point density and STL data model after polygonization.
The measurement scope for evaluating the Bosch-Shaft with twelve teeth has remained identical to that used for the tactile validation measurements when evaluating the optically determined data with the Zeiss Atos Q. However, there is a significant difference in the recording of measuring points. For the subsequent mathematical evaluation regarding gear characteristics, the complete recording of the workpiece is necessary. Depending on the number of teeth, generating the data set takes significantly longer than tactile measurement with a GMI or CMM. An overview of the measurement scope and the measurement times is shown in Table 2.
Klingelnberg P40
Zeiss Prismo verity
Zeiss Atos Q
Measuring principle
Tactile
Tactile
Optical
Scope of measurement
All-tooth measurement 12 teeth profile / helix / pitch / runout / tip circle / root circle / topography 1 tooth 21 intersections
Dataset size point cloud STL
-
-
145 MB
Preparation
1 min
1 min
10 min
Dataset creation
-
-
8 min
Measurement time
14 min
15 min
3 min
Total time
15 min
16 min
21 min
Table 2—Bosch-Shaft tactile/optical measurement scope and measurement times.
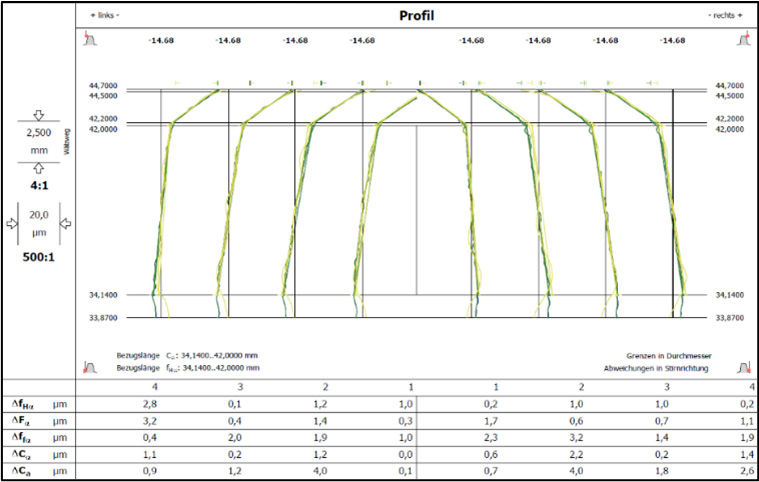
The differences in the measurement results are again displayed using the actual-actual comparison function in the same way as in the section “Bosch-Shaft Tactile System Validation.” The classic characteristic profile is shown as an example in Figure 8 for the measurement data of Klingelnberg P40 (green), Zeiss Prismo verity (blue) and Zeiss Atos Q (yellow).
The system-related lower measuring point density of the fringe projection generates, especially in profile direction, rounding in edge areas due to polygonization and thus leads to falsification of the measurement result. At the Bosch-Shaft, there are only about 100 points in the profile direction after polygonization. Figure 9 visualizes the profile comparison results from Figure 8, enlarged for fringe projection systems’ “critical” edge areas after polygonization and gear evaluation, transition area involute zone into profile tip relief, and transition area into root zone/protuberance.
Figure 9—Bosch-Shaft tactile/optical actual-actual comparison profile enlarged: a) tip and b) root area.
For all determined characteristics of profile and helix, the respective differences are Δ < 6 μm. For the determined characteristics of pitch, runout, and spanwidth, the respective differences are Δ < 3 μm. The differences determined are thus within the known orders of magnitude of tactile/optical comparison measurements of gears (Ref. 5).
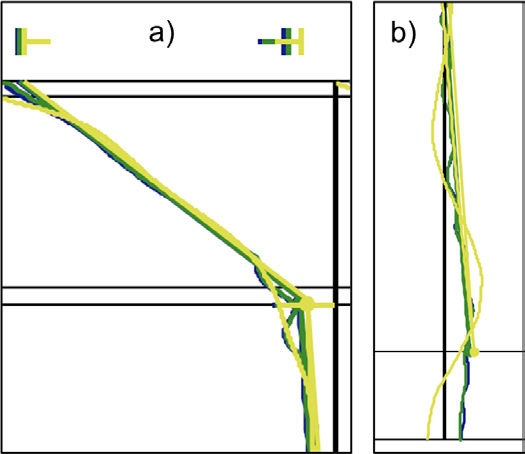
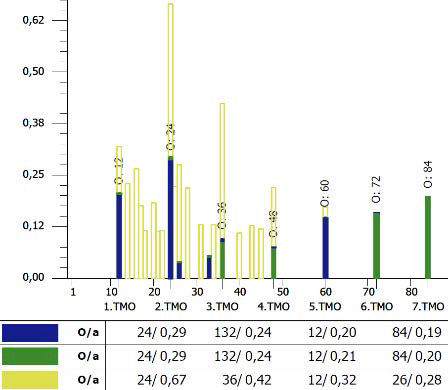
The differences for the waviness characteristic order spectrum are shown as an example for the profile measurement data in Figure 10. In Figure 10b, you can see the noise of the order spectrum of the measurement data determined by fringe projection (yellow) in the low-frequency range and the lack of detection of orders in the high-frequency range in an enlarged and colored variant. This makes it difficult to reliably detect frequencies. The numerical differences in the orders found are in the range Δ > 50 nm.
Figure 10—Bosch-Shaft tactile/optical actual-actual comparison order spectrum profile: a) overview and b) enlarged.
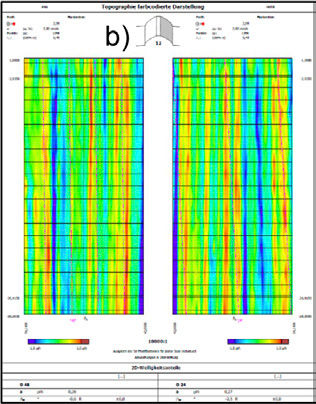
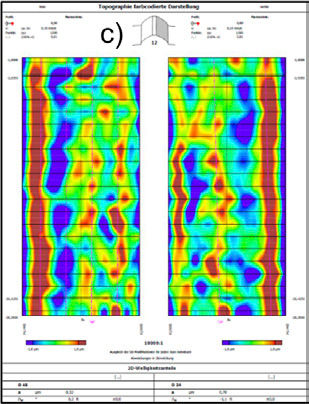
The comparability of the waviness characteristic helix angle of waviness (βw) for the largest order found is shown in Figure 11. The differences between the two tactile measurement results and the optical measurement result are in the range of Δ < 1.5°. In Figure 11, there is a visual comparison of the optical system given, but it is presented in a “damped” way. The reason for the visual differences can be explained by the noisy result of the order spectrum; the physical system-related restrictions cannot be dismissed out of hand at this point. The differences determined by the tactile system validation and the tactile/optical comparison are summarized in Table 3.
Figure 11—Color-coded topography Bosch-Shaft tactile/optical: a) Klingelnberg P40, b) Zeiss Prismo verity and c) Zeiss Atos Q.
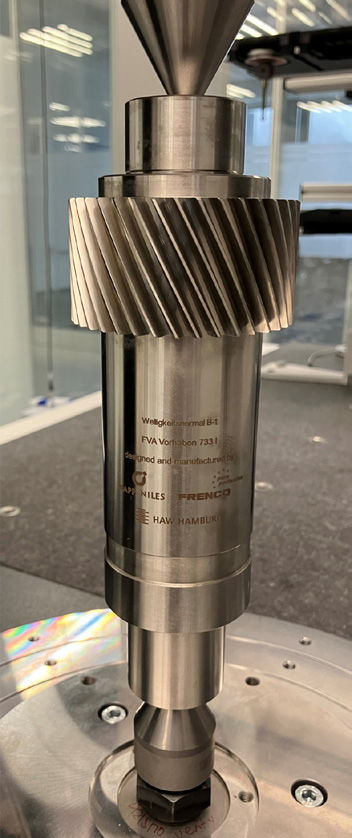
Since there were no conspicuous waviness on the Bosch-Shaft, but the question of reliable detection of waviness characteristics, with fringe projection systems for Bosch was in the foreground, two waviness artifacts from the Forschungsvereinigung Antriebstechnik e.V. (FVA) from the project FVA involute waviness artifacts (Ref. 6) could be used for the comparison. The two waviness artifacts are grinded artifacts with specifically applied waviness of different orders (Figure 12). Both waviness artifacts are helical external gears with: number of teeth (z) 37, normal module (mn) 1.75 mm, and facewidth (b) 40 mm. For the tactile/optical comparison, the waviness artifact B1 (order 37, 1. Tooth Mesh Order [TMO]) and D1 (order 45, 1. TMO ± 8) were available. In the FVA research project no. 733 I, twelve tactile Klingelnberg GMI were used to determine the waviness applied by production technology in a ring comparison in 2018. The amplitudes of the waviness were in a range < 0.5 μm.
Figure 12—FVA involute waviness artifact B1.
For the results presented below on the two FVA involute waviness artifacts, the same methods, repeatability measurements, and results presentations were used as described in the sections “Bosch-Shaft Tactile System Validation” and “Bosch-Shaft Tactile/Optical Comparison” for the Bosch-Shaft Table 4 shows the measurement scope and the measurement times. The differences of all determined characteristics are shown in Table 5.
Klingelnberg P40
Zeiss Prismo verity
Zeiss Atos Q
Measuring principle
Tactile
Tactile
Optical
Scope of measurement
All-tooth measurement 37 teeth profile / helix / pitch / runout / tip circle / root circle / topography 1 tooth 31 intersections
Dataset size
point cloud STL
-
-
450 MB
Preparation
1 min
1 min
20 min
Dataset creation
-
-
18 min
Measurement time
31 min
30 min
5 min
Total time
32 min
31 min
43 min
Table 4—Tactile/optical measurement scope and measurement times for FVA involute waviness artifacts.
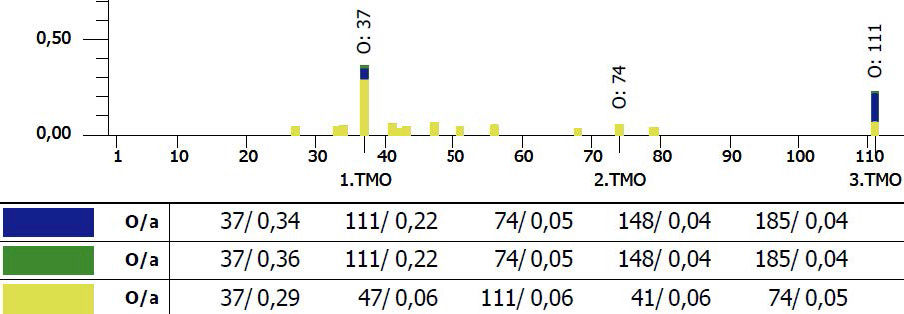
As an example, Figure 13 shows the waviness characteristic order spectrum profile of the FVA involute waviness artifact B1 for the measurement data of Klingelnberg P40 (green), Zeiss Prismo verity (blue), and Zeiss Atos Q (yellow).
Figure 13—Tactile/optical actual-actual comparison order spectrum profile FVA involute waviness artifact B1: a) overview and b) enlarged.
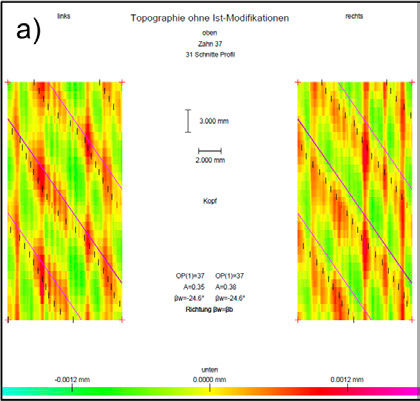
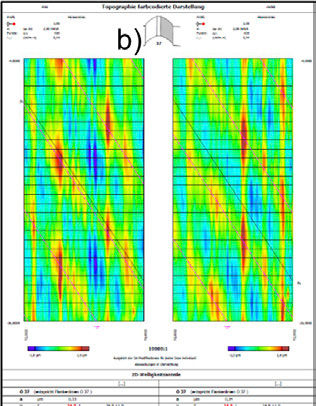
In Figure 14, the color-coded topography plots for the visualization of the waviness characteristic helix angle of waviness (βw) of the FVA involute waviness artifact B1 are shown, in Figure 15, correspondingly, for the FVA involute waviness artifact D1.
Figure 14—Tactile/optical color-coded topography FVA involute waviness artifact B1: a) Klingelnberg P40, b) Zeiss Prismo verity and c) Zeiss Atos QFigure 15—Tactile/optical color-coded topography FVA involute waviness artifact D1: a) Klingelnberg P40, b) Zeiss Prismo verity, and c) Zeiss Atos Q.
The results obtained on the FVA involute waviness artifacts tend to be comparable to those on the Bosch-Shaft, and even significantly better for some characteristics, since the surface quality of the artifacts is of higher quality than that of the Bosch-Shaft.
Note: The aim of this investigation with regard to the FVA involute waviness artifacts was primarily to analyze a suitable measurement object with specifically applied waviness with different measuring systems and not to achieve comparability with the FVA research project no. 733 I, since the detection of the helix angle of waviness (βw) was not part of the investigation in the FVA project at that time.
Summary and Conclusion
The use of fringe projection measuring systems for gear metrology is generally suitable. However, the suitability depends heavily on the measuring object. Classic characteristics are comparable to tactile measuring systems in the range of Δ < 5 μm, and in some cases, much more accurate in the range of Δ < 3 μm. Regarding waviness characteristics, suitability can be assessed as conditional. If orders are found, they are quite comparable in the range of 50 < Δ < 200 nm to the amplitudes found by tactile systems. However, noise in the low-frequency range of the order spectrum and the partial lack of detection of orders in the high-frequency range can lead to misinterpretations regarding the noise analysis. On the other hand, the very good comparability of the helix angle of waviness (βw) is remarkable. Both the Bosch-Shaft and the FVA involute waviness artifacts were comparable to tactile measurement results in the range of Δ < 1° to 1.5°. Basically, the causes of differences between optical and tactile measurement results can be found in the physical measurement principle itself. The issue of orthogonal accessibility in tooth spaces and generally accessibility in internal gears limits suitability. In addition, the working distance and the measuring field used influence the measurement point density. The subsequent polygonization of the individual scans of fringe projection measurement systems negatively impacts the measurement result, especially in edge areas, as it results in rounding effects. Regarding gears, these are primarily the transition areas from the root or protuberance area to the main involute area, as well as the transition from this to the tip relief or tip chamfer area. The effect is a potentially strong influence on the regression elements in the sub-areas, which primarily affects the calculation of profile and helix slope deviations (and thus also on the profile and helix total deviations). Likewise, of course, on the calculation of the regression elements in the relief areas, if existing. Additional efforts, such as spraying-in and cleaning the measurement objects as well as the attachment and removal of reference marks, have a primary effect on the total measurement time and only in a subordinate way on the measurement results. This can certainly be optimized for series measurements by means of fixtures and spraying devices. In contrast to the above-mentioned points, one of the strengths of fringe projection is definitely the possibility of additional visualization options such as a holistic color-coded nominal/actual comparison, if a CAD model of the gearing is available. Since a complete STL data model of the gear is always available for the determination of gear characteristics, the measurement scope can be adjusted at any time, also after the measurement process itself. For example, in the event of a gearbox failure, the data of individual gears could be re-evaluated for additional analyses and also with additional detailed topographical evaluations. Fringe projection thus primarily offers added value as a supplementary tool for development and analysis. Special features of the measurement software from Zeiss are, on the one hand, the possibility that the same measurement programs from Calypso and Gear Pro can be used for tactile and optical measurements with an identical measurement and evaluation strategy, and on the other hand, the advantage that an all-tooth measurement is not necessarily required to determine the helix angle of waviness (βw) (Ref. 4).
Acknowledgement
Special thanks go to Mr. Matthias Fath from HAW Hamburg and Dr. Stefan Groß as well as to the Arbeitskreis Messtechnik of the Forschungsvereinigung Antriebstechnik e.V. for providing the two FVA involute waviness artifacts. Many thanks also to Prof. Dr.-Ing. Günther Gravel for his support in the preparations of the comparison measurements.
Groß, R.: „Vergleich verschiedener Messmethoden in der Verzahnungsmesstechnik – Messen zwischen Spitzen als Hybridsystem neu gedacht“, 7. VDI-Fachtagung Verzahnungsmesstechnik 2021, Nürnberg – VDI-Berichte Nr. 2393.
Gravel, G.; Kahnenbley, T.: „Neue Entwicklungen zur Welligkeitsanalyse akustisch auffälliger Verzahnungen“, 6. VDI-Fachtagung Verzahnungsmesstechnik 2017, Leonberg – VDI-Berichte 2316.
Kunzmann, S.: „Mathematischer Ansatz und die Realisierung von Welligkeitsanalyse-Werkzeugen“, 8. VDI-Fachtagung Verzahnungsmesstechnik 2024, Nürnberg – VDI-Berichte 2440 ISBN-Nr.: 978-3-18-092440-3 (E-ISBN-Nr.: 978-3-18-102440-9).
Groß, R.: „Vergleich verschiedener Messmethoden in der Verzahnungsmesstechnik – Kunststoffzahnräder auf Koordinatenmessgeräten und berührungslosen Mess-systemen“, 6. VDI-Fachtagung Verzahnungsmesstechnik 2017, Leonberg – VDI-Berichte Nr. 2316.
FVA Stirnrad-Welligkeitsnormale, Forschungsvorhaben Nr. 733 I, Heft 1308, 2018.