Twenty Years of Pulsator Tests on Helicopter Gears
In the design of aerospace transmission systems, particularly those used in rotorcraft, fatigue life prediction plays a pivotal role in ensuring both performance and reliability. Due to the very high values of the torque and power densities of the main gearboxes (MGB) of modern helicopters and to the catastrophic consequences of their failure, a precise and reliable approach to the design and rating of gears is fundamental. In general, the tooth root bending fatigue failure is not the most limiting failure mode for an MGB, but it is the most critical, due to the consequent immediate interruption of the transmitted power.
For this reason, Leonardo Helicopters started a systematic campaign of testing 20 years ago, aimed at characterizing the tooth root bending properties of the gears applied in MGBs. More in detail, the purpose of the program was to investigate the performance of the applicable design solutions and parameters, in terms of materials, cleanliness, manufacturing processes, heat treatments, finishing and superfinishing approaches, and shot peening. The purpose was not limited to determining validated data in terms of fatigue limits. A precise understanding of the morphology of the S-N (Wöhler) curve is critical, as helicopter gear components are typically designed to operate within the very high cycle fatigue regime, and at the same time, they must also be capable of withstanding occasional short-duration overloads, arising from transient operating conditions. Enhanced characterization of the S-N curve facilitates more refined and efficient gear design, minimizing unnecessary conservatism while maintaining adequate safety margins and structural integrity under complex loading spectra (Refs. 1, 2).
A first technical paper, with the results for some families of case-hardening steels, was presented at the 2008 AGMA FTM (Refs. 3, 4). Since then, many other materials and influencing parameters have been investigated; some results have been presented at gear conferences (Ref. 5) or in journals (e.g., Ref. 6), and some of them are still unveiled. In any case, a comprehensive summary of the results and a systematic comparison and analysis of the influence parameters have never been published.
For this reason, after 20 years of testing, the time is mature to propose such a comprehensive synthesis, and the authors believe that the AGMA FTM is the most suitable place to present it, not only for its scientific relevance, but also for its focus on the practical application of the knowledge.
Pulsator Test as a Means to Estimate the Root Strength
When investigating the strength of gears, experience suggests that it is not sufficient to conduct tests on standard specimens, like those for rotating bending or axial tests, for instance. To appropriately consider all the characteristics related to the gears manufacturing process, including those coming from the cutting and finishing processes, like roughness and residual stresses, and from the heat treatment, which is dependent on the specific geometry, the most suitable option is to test gear specimens. In this way, the process to transfer the strength data obtained from the tests to the real design application is more straightforward and does not require additional assumptions, besides those already necessary to consider several factors. At most, the information provided by tests on standard samples is useful in preliminary pre-screening because they can provide data in a short time, but they are not suitable for a detailed and reliable assessment.
Gears are susceptible to a variety of failure mechanisms, the prevalence of which is influenced not only by material properties but also by numerous factors related to the specific design and operational conditions (e.g., Ref. 7). Certain damage modes—such as scuffing and contact fatigue—can only be effectively investigated under conditions that replicate gear meshing. For these mechanisms, dedicated testing methodologies and specimen geometries have been developed over time to ensure that the experimental setup selectively targets the intended failure mode while minimizing interference from others. Even if the tooth root fatigue fracture failure mode shows some difference depending on whether meshing is or is not reproduced, experience demonstrates that tests in which selected tooth flanks are loaded by means of a universal testing machine with appropriately designed anvils provide a reliable and effective means of evaluating the bending fatigue strengths.
The simplification of loading conditions in this type of test offers several advantages over conventional meshing tests. Firstly, these tests are carried out on universal testing machines and not on a dedicated gear test rig, thereby streamlining test setup and management. This configuration allows greater freedom in the specimen geometry, enabling the testing of a wide range of spur gear sizes, geometries, and profiles, with only minor practical limitations for very small modules. By isolating and testing individual teeth instead of the whole gear, multiple samples can be obtained from a single gear specimen, significantly reducing testing costs. Furthermore, unlike running gears (RG) tests, which require a loaded tooth contact analysis (LTCA) method to exactly estimate the force cycle acting on a single tooth, followed by a stress analysis calculation method to determine the corresponding root stress cycle, pulsator tests necessitate only the latter. The force acting on the specimen is known a priori: indeed, the applied load is directly imposed (and measured) by the machine itself, eliminating the need for force estimation.
Nevertheless, pulsator tests, which do not involve meshing, lead to different results due to differences in statistics and in the fatigue damage mechanism: in particular, higher strength values are obtained if compared to those obtained through RG (Refs. 8, 9, 10, 11). The fatigue limit of pulsator tests can be 20 percent higher than in the RG case (e.g., Ref. 12). During the years, calculation methods, like the one developed in the German gear scientific community (i.e., Ref. 13), have been elaborated, and they allow a validated transfer of pulsator test data into strength values that can be used in the actual design phase.
Specimen Definition
The definition of the gear specimen geometry includes both the selection of the number of teeth and the design of the tooth geometry and profile. This has been done considering two main constraints. Firstly, the selection of a hobbing tool that already exists. Secondly, the possibility of performing tests at loads compatible with the testing machine, whose maximum load is 60 kN.
Moreover, although the test results should be independent of the geometry used, it has been considered that the calculation methods, however sophisticated they may be, introduce approximations in the calculation of the tooth root stress starting from the applied force. A first approximation regards the effect of the load application point on the state of stress of the tooth root, which is not subjected to a pure bending phenomenon but also compression and shear components. Therefore, an additional geometric requirement is that the position at which the pulsator applies the load corresponds to the highest point of single tooth contact when the toothed sample meshes with itself in its nominal condition.
An additional design choice is about the selection of the number of teeth that are located between the test punches, which corresponds to the number of teeth covered by the Wildhaber (or span) measurement (Ref. 14). To avoid testing teeth adjacent to those previously loaded, whose roots may have experienced prior stress cycles, albeit minor, the authors opted to exclude such teeth from subsequent tests. Consequently, the span measurement was selected to include an odd number of teeth, maximizing the number of usable specimen’s extractable from a single gear.
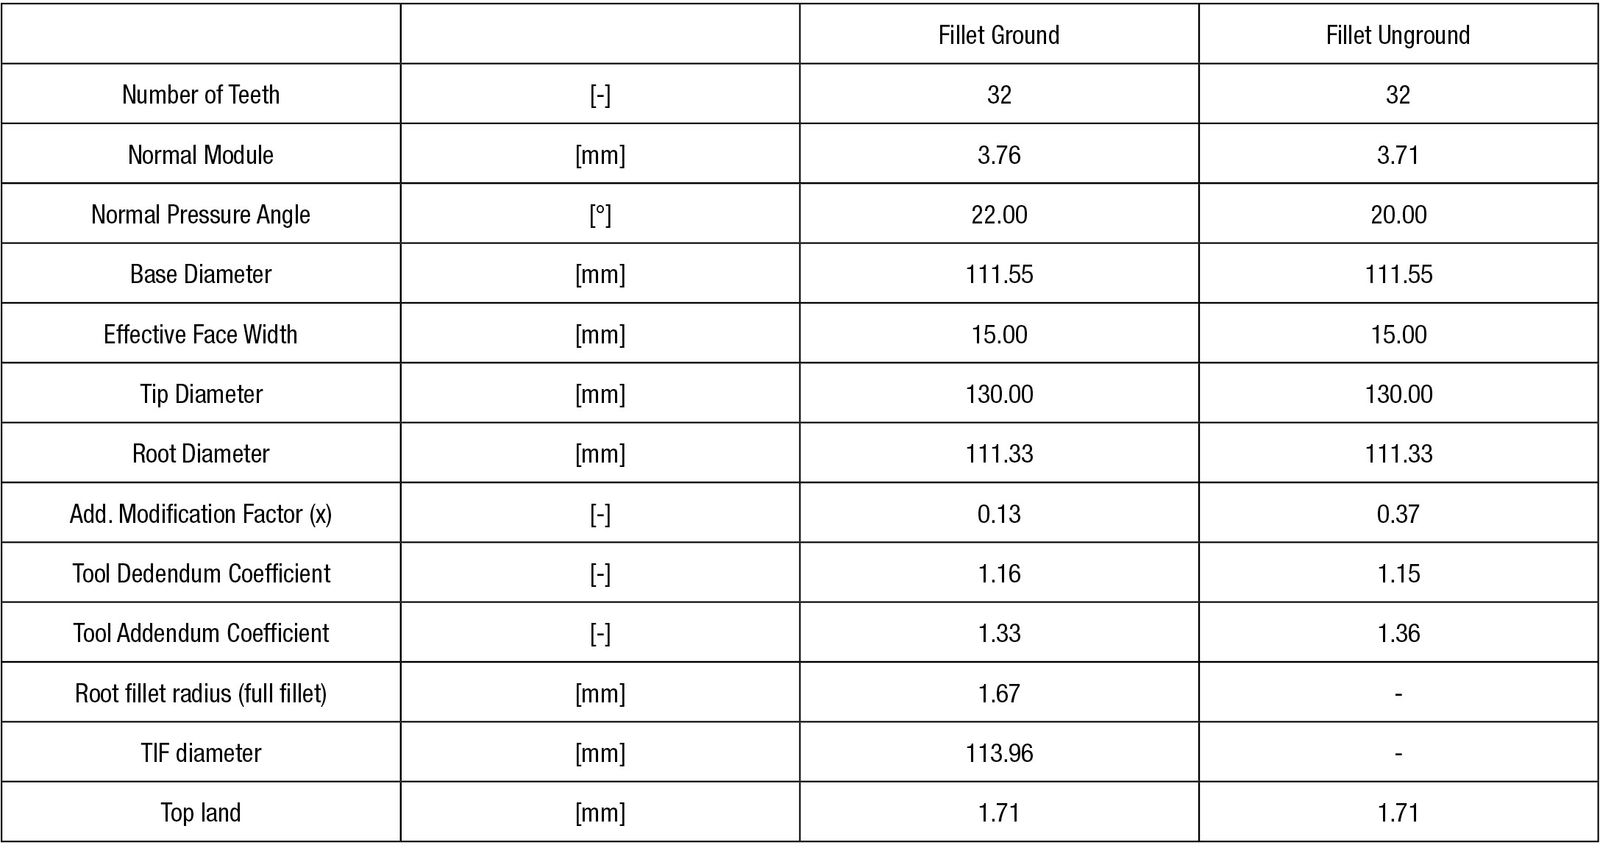
All the above requirements lead to the definition of the spur gear geometries reported in Table 1. The gears have 32 teeth, and the number of teeth considered for the span measurements was set to 5. As a result, each gear specimen allows for the extraction of eight testable pairs of teeth.
Table 1—Spur gear geometries.
The adopted gear specimens completely follow the production cycle of Leonardo. Hence, all gears present ground flanks. The difference between the two geometries is related to the possibility of having or not having a ground tooth root, depending on the different manufacturing processes. That is, the “Fillet Unground” geometry has a tooth root whose actual profile is produced during the tooth generation process, while the “Fillet Ground” root is manufactured using form grinding.
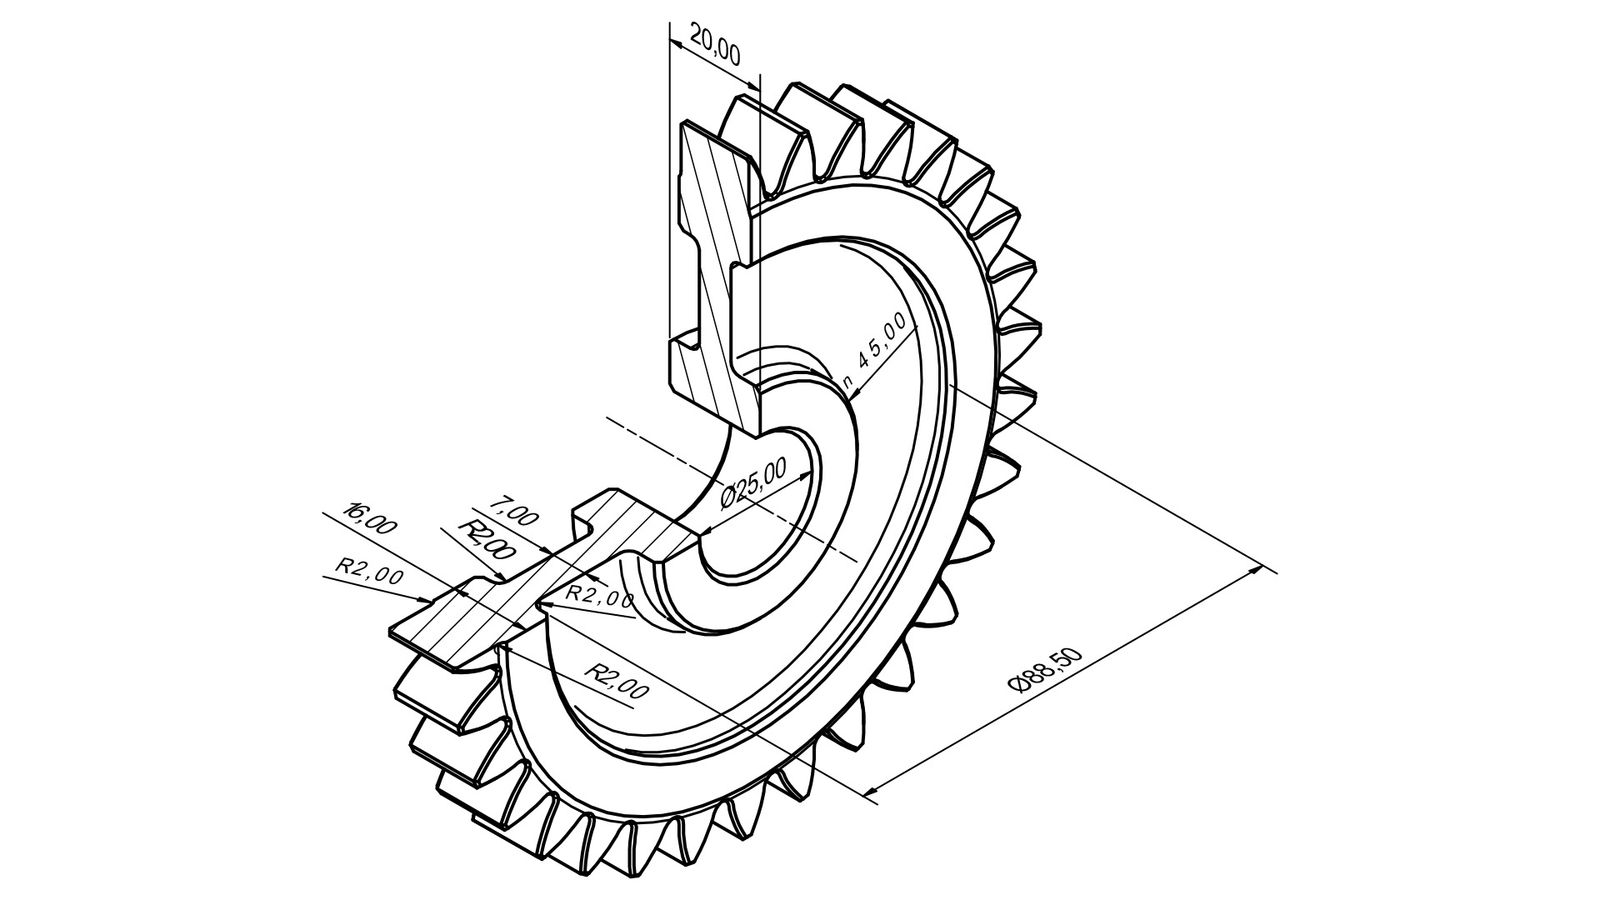
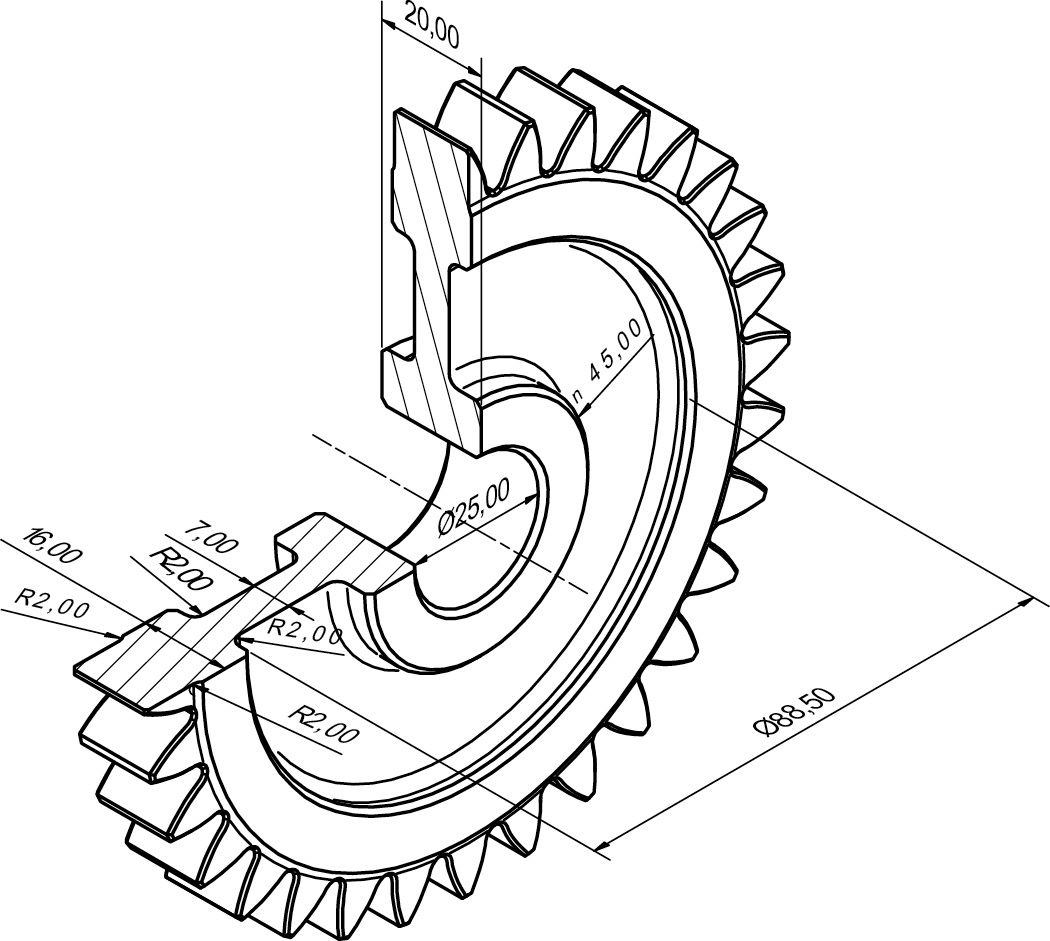
Furthermore, the adopted geometry incorporates features representative of practical applications, as shown in Figure 1. For instance, a thin rim—characteristic of lightweight gear designs—was included with proportions consistent with typical helicopter industrial practice. Another example is lateral fillets, which reduce stress at the base of the tooth.
Figure 1—Isometric section of the specimen with some dimensions highlighted.
Starting from the gear geometry, the relationship between the applied load and the corresponding tooth root stress can be assessed by means of both FEM analysis and the application of AGMA and ISO standard rating formulae, as summarized in Table 2.
Table 2—Force-stress relationship.
Test Method
There are two main types of pulsator testing (e.g., Refs. 15, 16, 17). In the first, called symmetric, the gear blank is not supported during the test execution and is loaded isostatically by the anvils, which, thanks to the Wildhaber measurement principle (Ref. 14), load two teeth at the same diameter, thus testing a pair of teeth at a time. Since the gear is not constrained by anything other than the anvils, once the test is completed (i.e., when the tooth fails), it can be immediately removed by an extraction device. For this reason, this approach, which is more common in Europe, can also be applied to mechanical resonance pulsators. In the second, corresponding to the SAE J1619 (Ref. 18) (firstly proposed by Buenneke et al., Ref. 15) called asymmetric, the gear blank is supported by a pin and only one tooth is actually tested: due to the presence of a supporting pin, the procedure is not compatible with a mechanical resonance pulsator because the gear cannot be immediately removed at the end of the test. The latter layout corresponds literally to the definition of single tooth bending fatigue (STBF). This test configuration, which is typically applied with hydraulic machines or with machines that can be immediately stopped at failure, is more frequently applied in the United States and United Kingdom.
[advertisement]
The tests performed within the framework of the present experimental program have been carried out with the symmetric configuration on a mechanical resonance pulsator, except for some tests that have been performed with a different layout and fixture, with a hydraulic machine, suitable for the application of load spectra to assess the robustness of the approach under variable load conditions.
For each family of gears considered, two types of tests are performed to investigate the strength of the tooth root. One is the actual fatigue test, in which a pulsating load is applied at a fixed position of the tooth flank until the failure of the specimen. The fatigue tests discussed here have been performed on a 60 kN Schenck mechanical resonance pulsator at a load frequency of about 35 Hz.
The latter is a static test on a hydraulic machine, performed to evaluate the ultimate strength of the teeth. Even if the static properties of the materials are already part of Leonardo’s expertise, and the quality control of production processes guarantees the fulfillment of the relevant requirements (i.e., all incoming raw materials are tested), for the sake of completeness, static tests are also performed on the gear specimens (and not on classical uniaxial specimens) to be consistent with the fatigue tests. In this way, a more complete and coherent characterization of the root strength is provided.
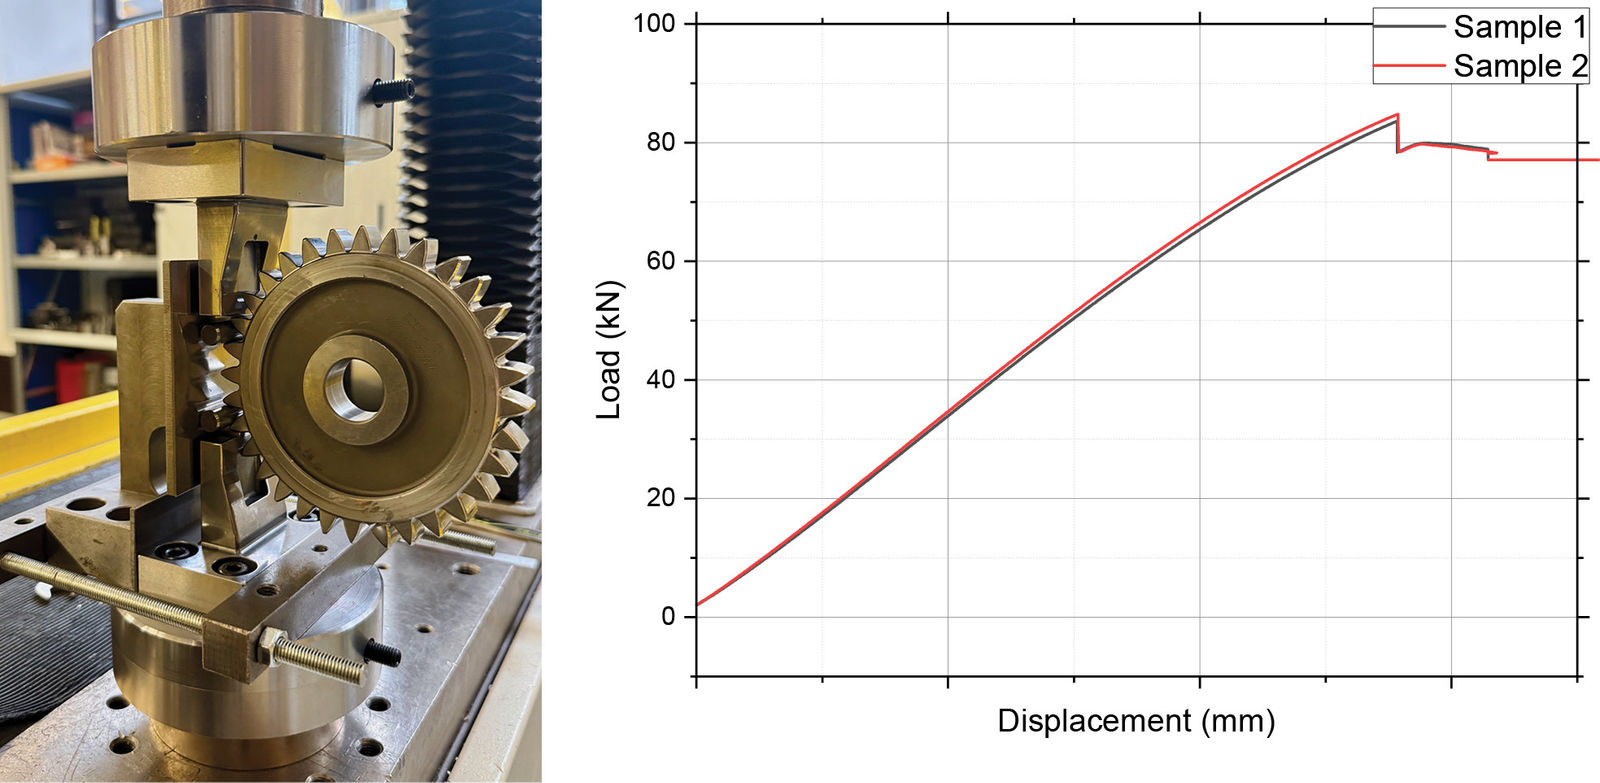
A typical test campaign involves the execution of about 35 pulsator tests, with points distributed along the entire Wöhler curve. The run-out level was set at 10 million cycles. Conversely, for the root ultimate load, 2/3 tests are carried out for each family. Figure 2 shows the fatigue test, while Figure 3 shows an example of the results obtained from the static tests.
(a) Static test arrangement (b) Static test outcome Figure 3—Static test phase.
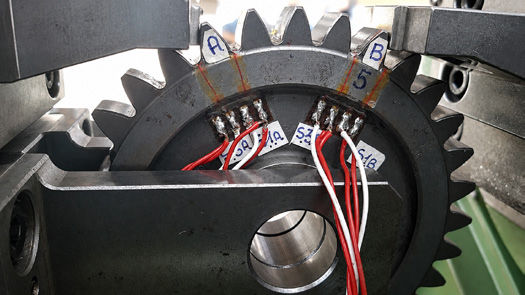
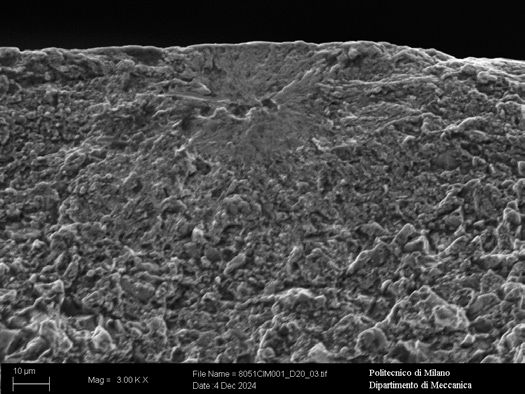
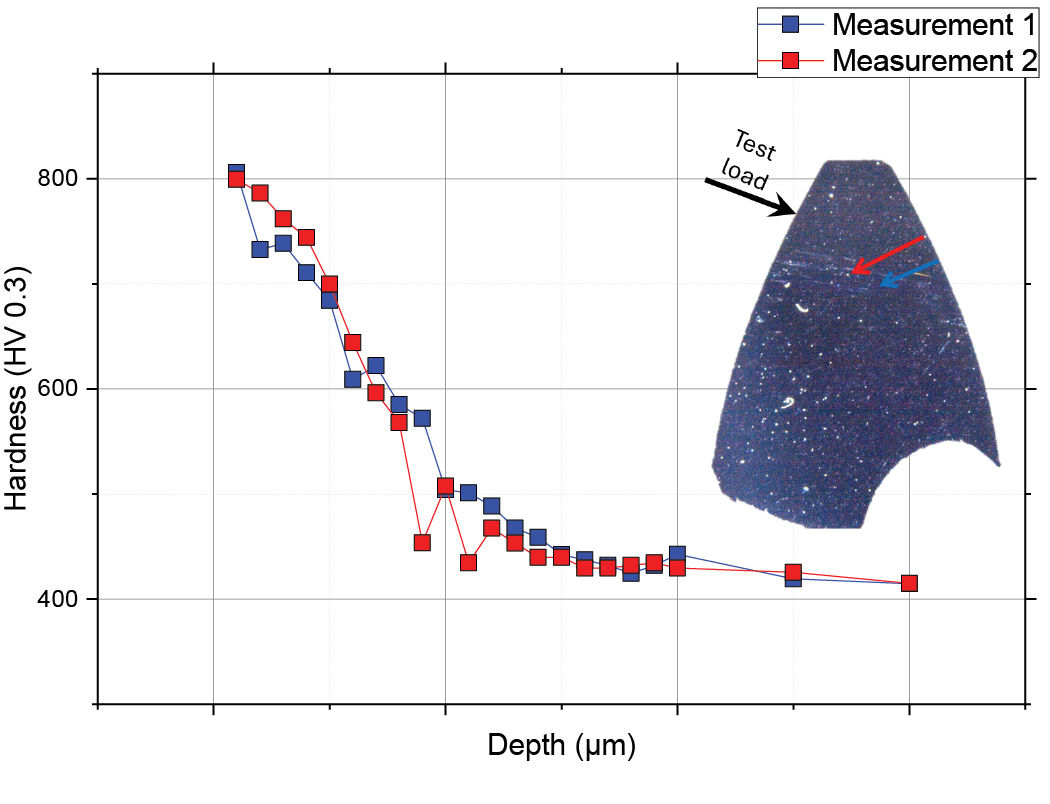
Pulsator tests are completed with various related activities. The first, carried out at the beginning of each test batch, involves the use of a strain-gauged gear to verify the alignment of the machine, checking that the machine provides a well-distributed state of stress along the root width. The information provided by this gear, shown in Figure 4, has also been used to verify the validity of the developed FEM models (e.g., Refs. 3, 6). Other related activities are aimed at evaluating the material from a more metallurgical point of view, such as SEM analysis of fracture surfaces to investigate the origin of the fracture (e.g., Figure 5), and microhardness profile analysis (e.g., Figure 6).
Figure 4—Strain-gauged gear for alignment verification.Figure 5—Example of SEM analysis of a broken tooth. Here, the failure was caused by a subsurface defect.
Data Evaluation Procedure
The aim of each experimental campaign is the definition of a continuous function that characterizes the complete S-N curve, ensuring a seamless representation across all fatigue life regions. According to the design procedure adopted by Leonardo, a continuous curve defined according to the following analytical equation has been used:
(1)
where S is the stress, N the number of cycles, SL the fatigue limit, and H, A, B and C are constant.
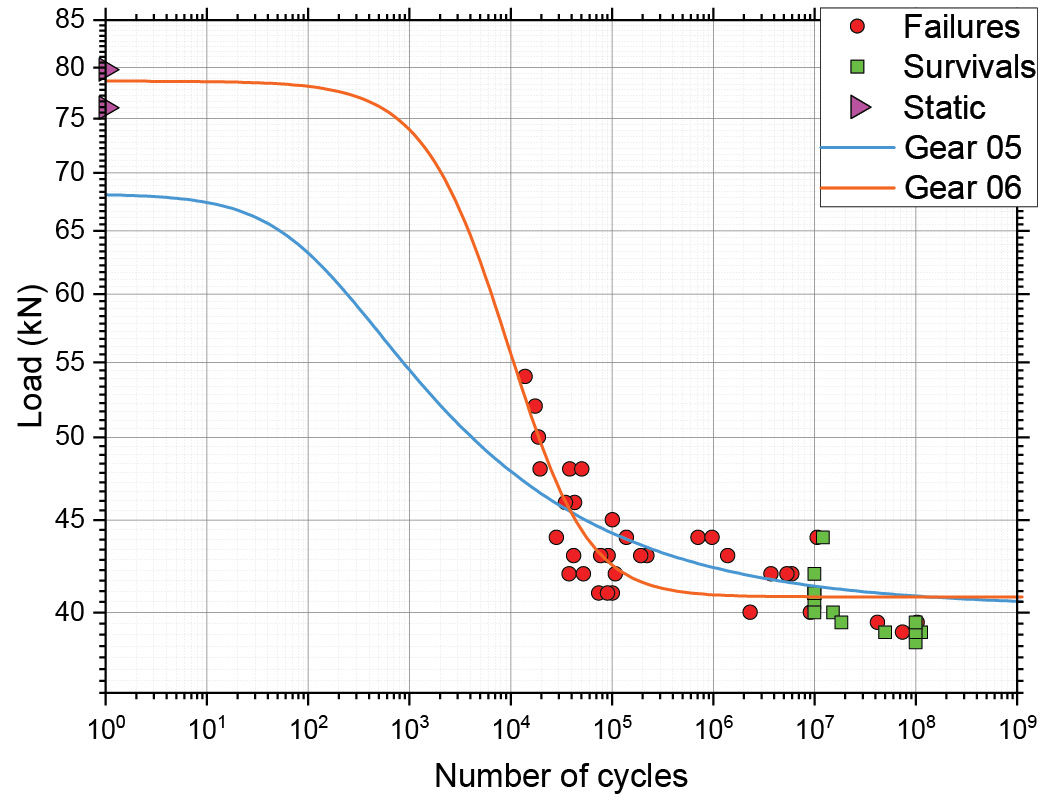
Depending on the constants introduced, different trends can be obtained. In the first phase, several shapes have been considered based on previous experiences of Leonardo to understand which were more suitable to fit the experimental test data on gears. Eventually, one of those, named GEAR05, has been selected. The selection of the most suitable curve has been done based on the minimum value of the coefficient of variation (CV), i.e., the ratio between standard deviation and mean, of the fatigue limit predicted by each of them. One more shape curve, named GEAR06, has been defined during the present research program, with the scope of enabling the fitting capability in the region of fatigue strength, and of obtaining CV values lower than those of the already available curves.
Therefore, the constants of the GEAR06 curve have been determined by means of a minimization procedure of the CV, for each of the families considered in the research program. In this context, CV is also used to evaluate the robustness of the single tested family.
In the definition of the GEAR06 curve, the ultimate strength of the tooth is also considered. In this way, a strong correlation between the fitted curve and the experimental data in the low-cycle fatigue regime is provided. In any case, this does not mean that the curve is meant to be applied in the low-cycle fatigue region, where a strain-based approach should be used instead of the stress-based one, which is limited to the high-cycle fatigue region.
This paper is not focused on discussing the differences among the different shapes of the S-N curve, and for this reason, the results of the single families of materials are presented in terms of the GEAR06 curve only. Nevertheless, a summary in terms of the GEAR05 is also included.
The parameters are estimated by means of a minimization procedure in which, for mathematical reasons, tests that did not end with a failure (i.e., the runouts) are considered as failures. At the earliest stages of this long-term research project, some very-high-cycle (i.e., ≥108) pulsator tests have been conducted to verify that the proposed curve properly represents the root lifetime at a very high number of cycles; that is, to verify the presence of the horizontal asymptote represented by the fatigue limit. Figure 7 shows an example of the estimated curve together with the experimental points.
Figure 6—Example of a hardness profile as a function of depth.Figure 7—Example of estimated curves.
Tests Results
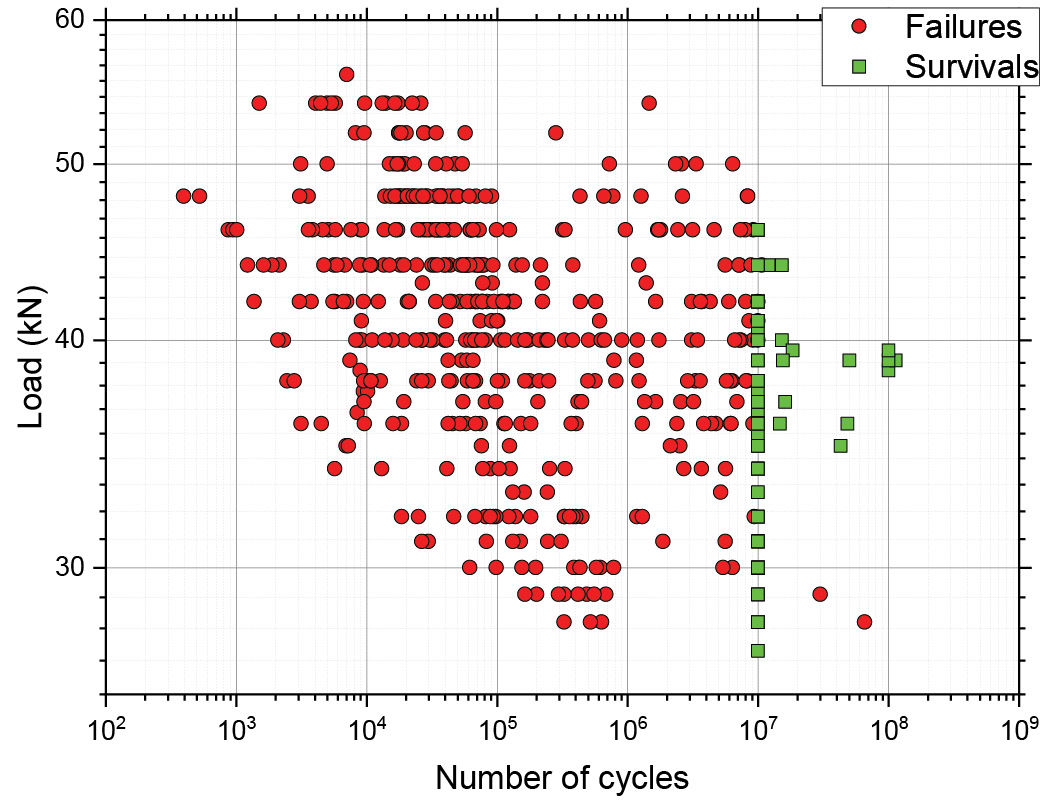
More than 650 fatigue tests have been performed in these 20 years, for a total number of cycles of 3.13 billion load cycles, which corresponds to a machine time of almost 3 years. Figure 8 reports all those data points. Among the tested families, the application of isotropic superfinishing to the root with two different processes (i.e., REACH-compliant and non-REACH-compliant) to gears in AISI 9310—shot peened—did not result in curves that are statistically different. Therefore, both families have been merged into a unique one (i.e., 9310 VIM-VAR – SP+ISF)
Figure 8—Fatigue data overview.
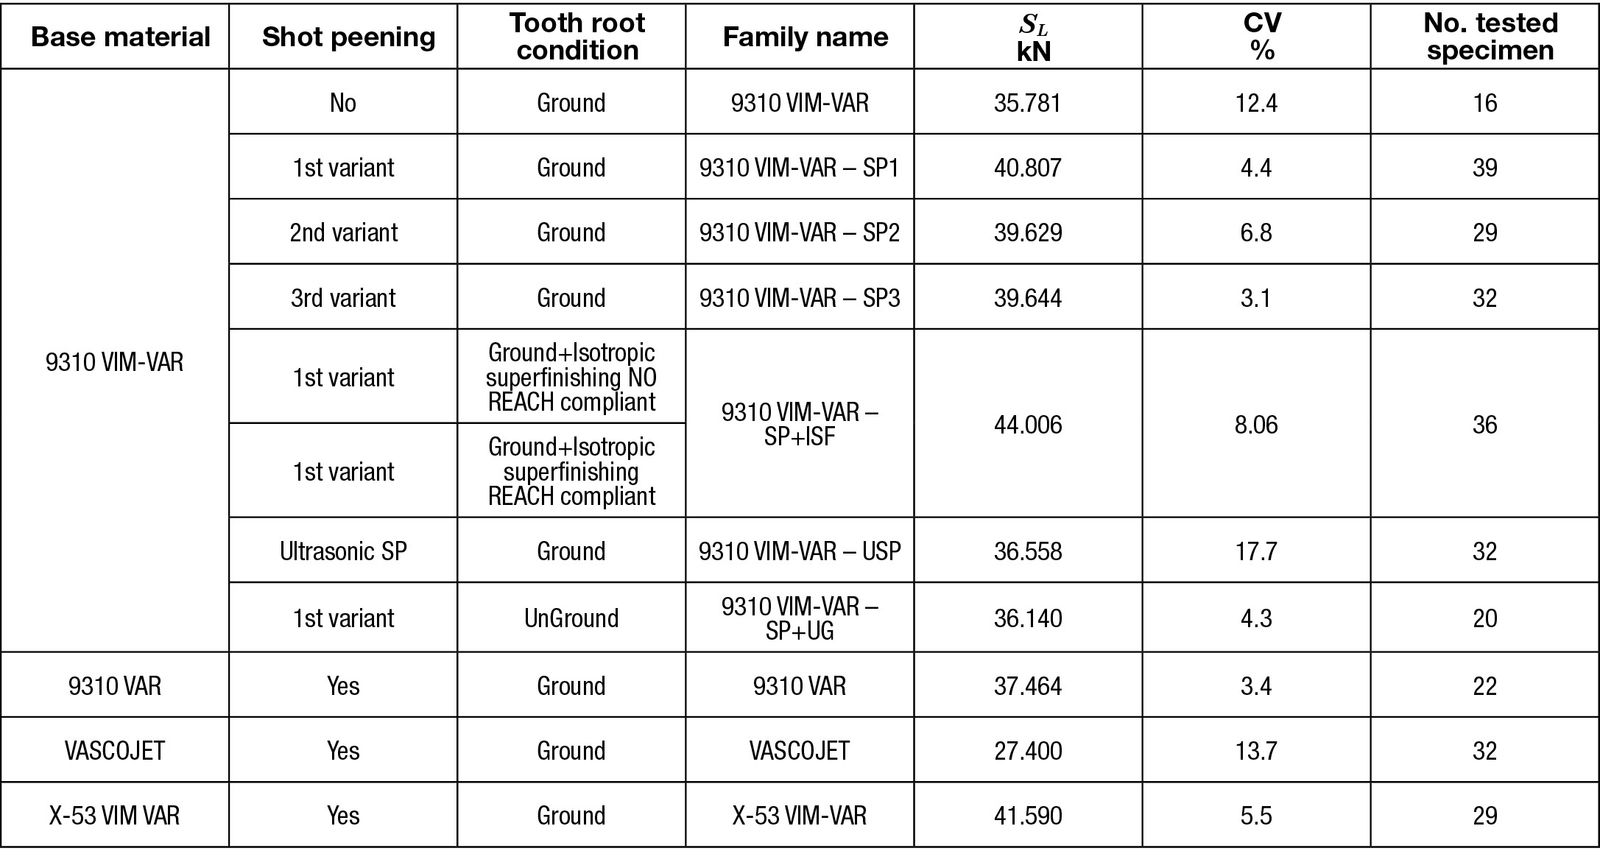
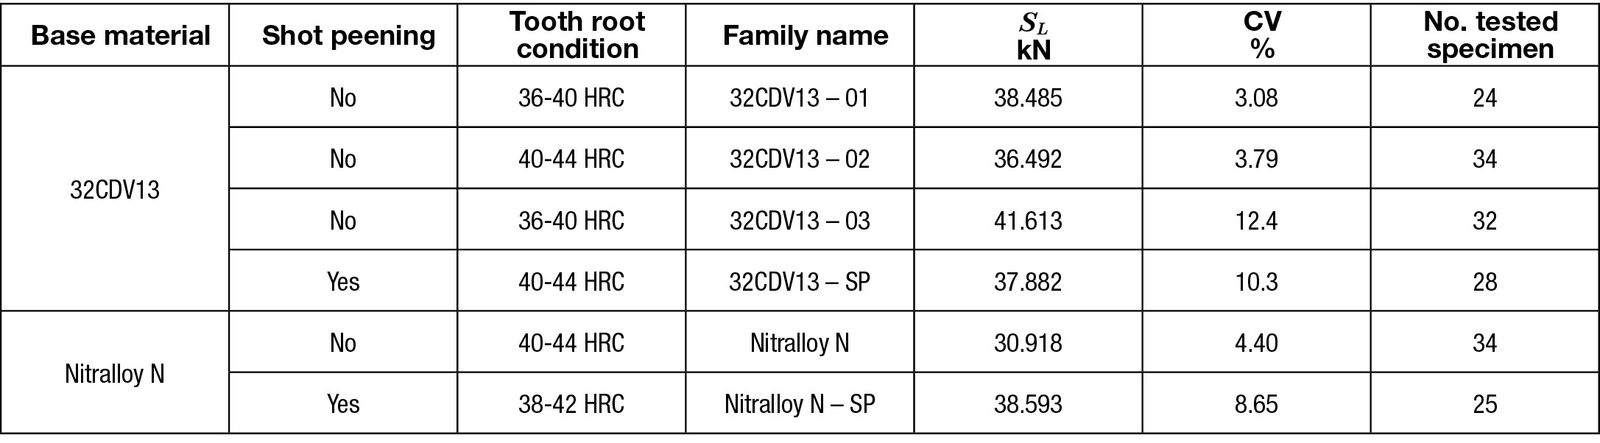
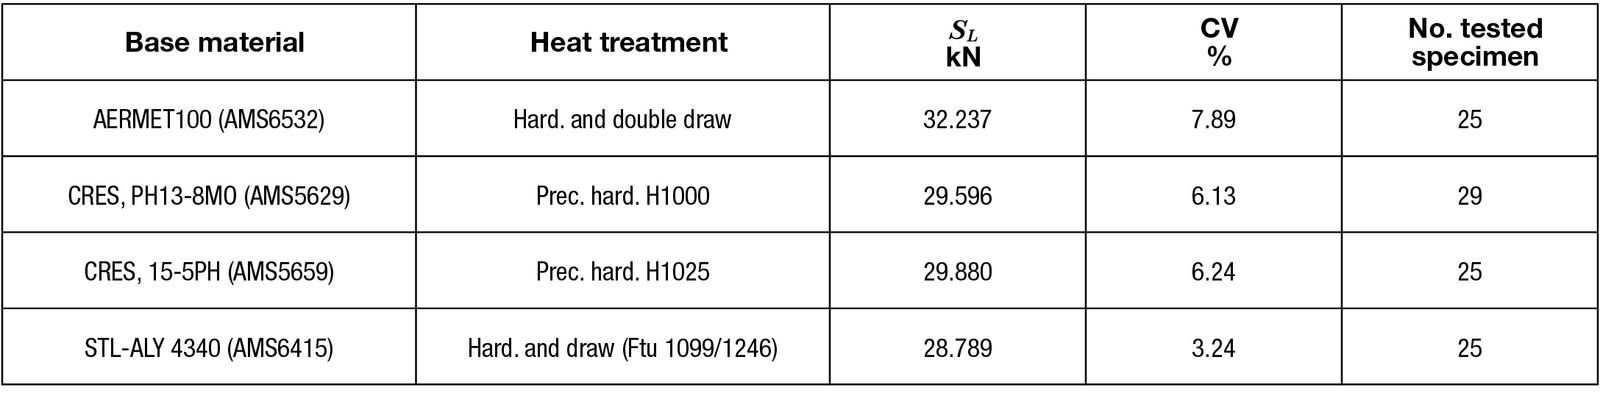
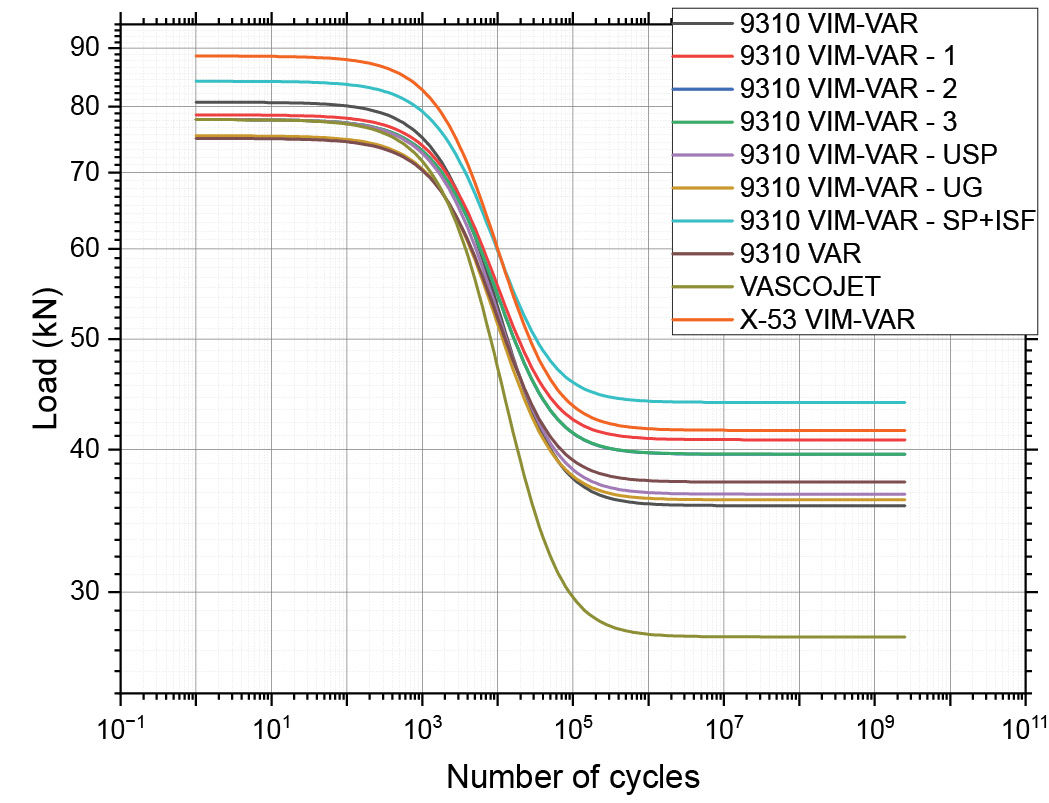
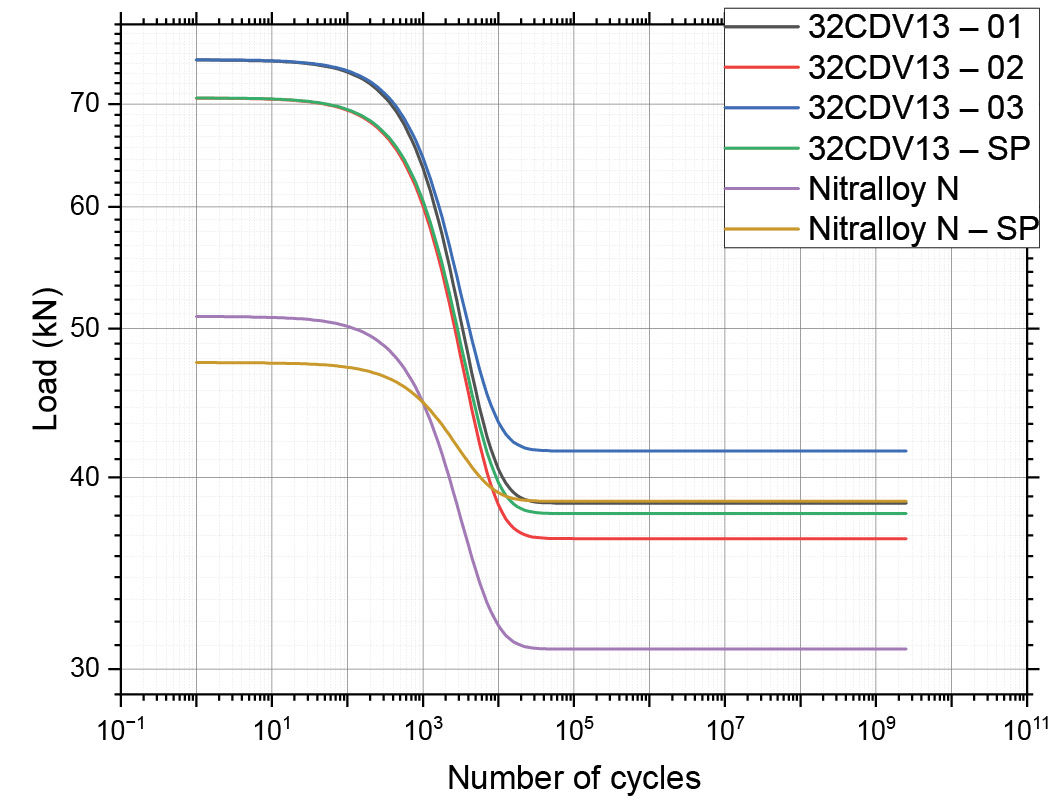
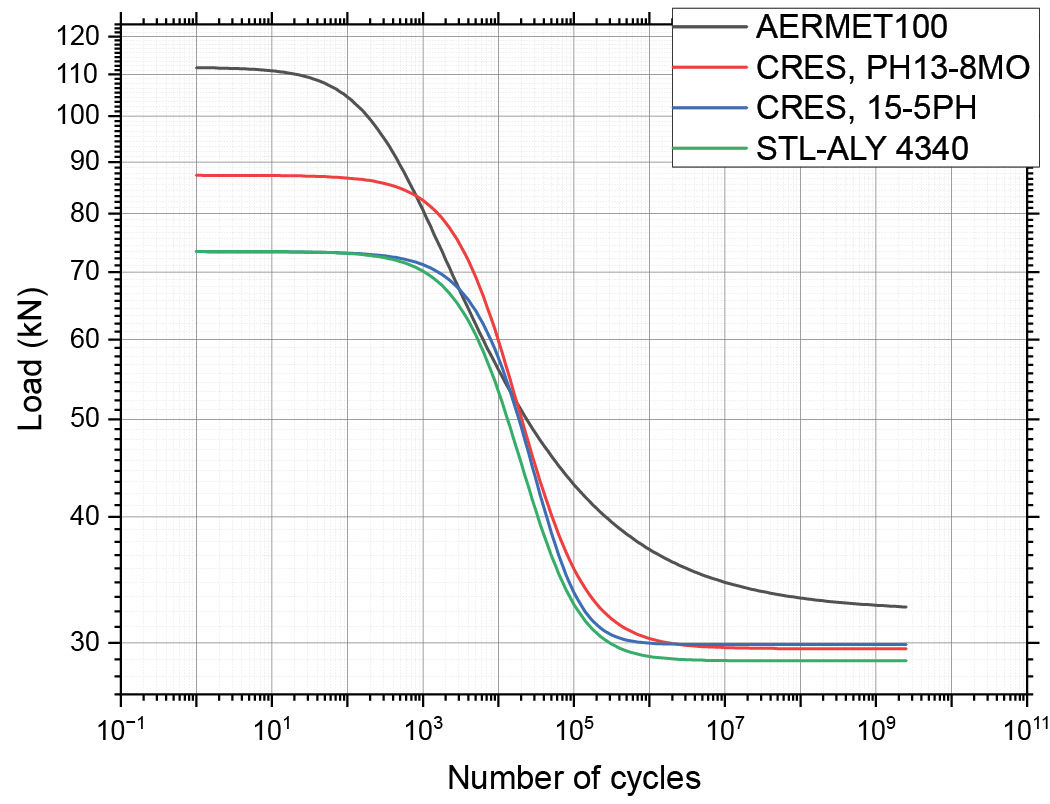
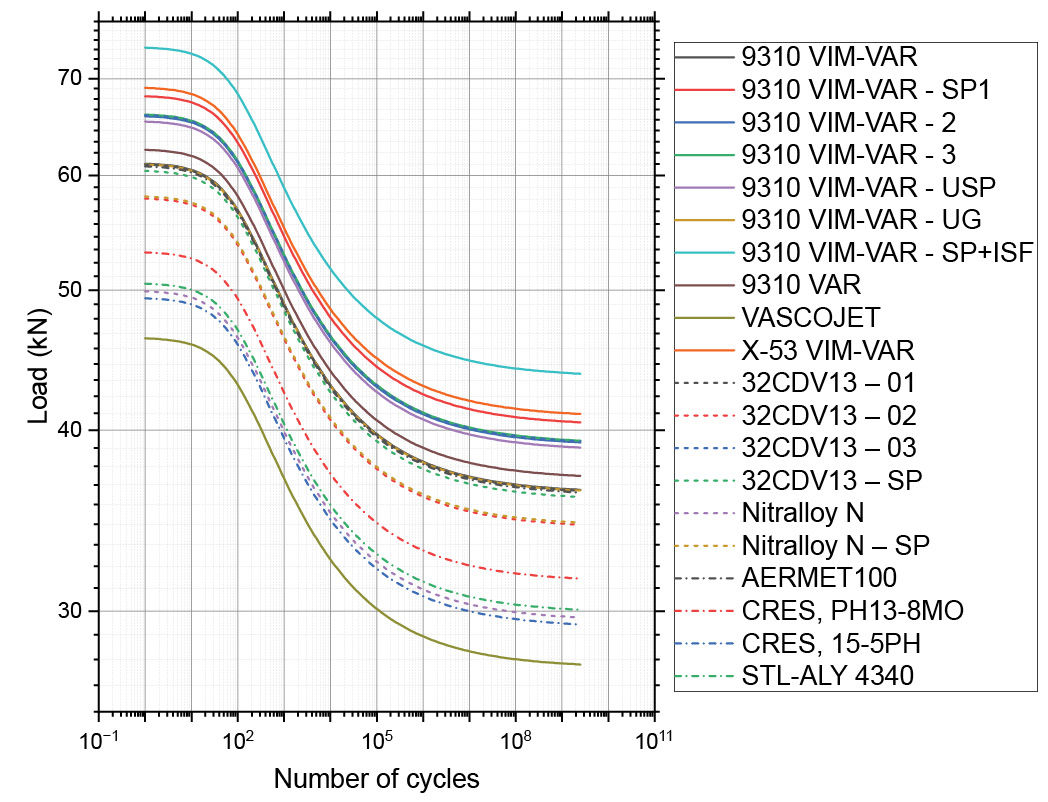
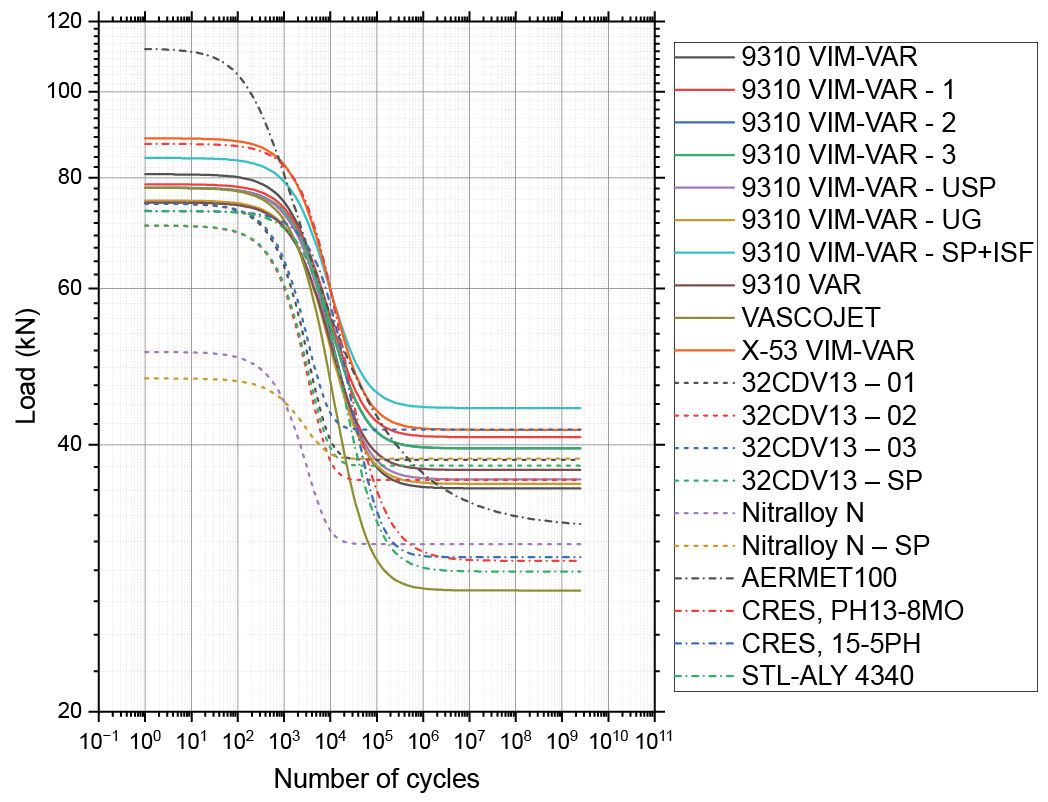
Table 3, Table 4, and Table 5 summarize the main tested families, while Figure 9, Figure 10, and Figure 11 report the corresponding GEAR06 curves. Instead, Figure 12 and Figure 13 provide a comprehensive summary of all the tested specimens. All curves (and data) reported here are average ones (i.e., 50 percent probability of failure).
Table 3—Main families of tested case-hardened gears.Table 4—Main families of tested nitrided gears.Table 5—Other families.Figure 9—Curves of the tested case-hardened gears.Figure 10—Curves of the tested nitrided gears.Figure 11—Curves of the tested “other” materials.Figure 12—All curves, estimated according to the GEAR05 curve shape.Figure 13—All curves, estimated according to the GEAR06 curve shape.
Considering the gear material presented here, for case-hardened gears, X-53 VIM-VAR presents higher strength values than 9310 VIM VAR. However, at this moment, the application of Isotropic Superfinishing to shot peened 9310 VIM VAR (i.e., 9310 VIM-VAR – SP+ISF) provides the highest fatigue limit. In any case. tests on the isotropically finished version of X-53 VIM-VAR are currently ongoing. Focusing on nitride gears, 32CDV13 can be considered the most suitable one. Other materials presented here exhibit lower performance and are used for noncritical parts and accessories.
The tooth root grinding is beneficial to the load capacity of the tooth root. This not only reduces the nominal stress at the tooth root (see Table 2) but also improves the surface conditions of the same. In fact, comparing the allowable stress limit for “9310 VIM-VAR – UG” and “9310 VIM-VAR – 1,” higher values are shown by the case with ground root.
Shot peening can significantly improve the root strength, inducing beneficial compressive residual stresses in the surface layer. This surface treatment mitigates the initiation and propagation of fatigue cracks, particularly under high-cycle loading conditions, thereby extending the service life and reliability of critical transmission components. In particular, for nitrided gear teeth, the possibility of increasing the fatigue limit through shot peening has been shown.
The strength values reported here are significantly higher than the values typically proposed by the standards, which are, fittingly, conservative. Such high strength values are achieved thanks to the selection of materials with very high cleanliness. Indeed, the higher the cleanliness, the higher the fatigue strength, as can be seen by comparing the cases of “9310 VAR” and “9310 VIM-VAR.”
It is important to note that the curves presented herein correspond to experimental data obtained from pulsator testing. These results reflect raw test outputs and are not directly applicable to design calculations. Before use in the design process, the data must be appropriately elaborated. A recommended method for such data processing is described in Refs. 13 and 19.
Conclusions
The extensive test campaign presented herein, encompassing the principal design alternatives currently in use, has resulted in the development of a comprehensive material database that serves as a foundational element for a robust and efficient design methodology. This dataset also enables refined fatigue damage assessments based on the complete operational flight spectrum.
The test procedure developed through this research initiative has been institutionalized as the standard protocol within Leonardo Helicopters for the systematic evaluation, benchmarking, and qualification of novel materials, advanced manufacturing processes, and innovative structural designs for gear components. This methodology now serves as a foundational element in Leonardo’s material and process validation framework, ensuring consistency, reliability, and compliance with aerospace performance and safety requirements.
The availability of a comprehensive database of Wöhler curves for materials employed in helicopter applications—capturing both the fatigue limit and the low-cycle fatigue behavior—enables a more accurate and reliable design process. Such a resource allows engineers to better predict component life and optimize structural integrity from the earliest stages of design. Although regulatory standards mandate full-scale testing, these tests not only confirm the results derived from the initial material testing campaign that generated the database but also provide essential data for calculating cumulative damage in accordance with the operational flight spectrum.
In compliance with current regulatory requirements (CS 29.571, Ref. 20), full-scale fatigue testing of complete helicopter gearboxes is performed to gear safe life substantiation. These tests are conducted under conditions that reflect the expected in-service power levels for each gear, incorporating a safety factor of 1.4 for a single test (or derived for multiple tests) to account for material and manufacturing variability.
The Safe Life evaluation is conducted through cumulative damage analysis in accordance with Miner’s Rule, utilizing the Wöhler curves positioned in accordance with the full-scale test outcomes in conjunction with the detailed flight load history.
Acknowledgement
The completion of this work, the result of over two decades of dedication, would not have been possible without the invaluable contributions of numerous individuals. We are grateful to all the people who contributed to the experiment with their ideas and work. We extend our deepest gratitude to students, researchers, professors, engineers, and the professionals from the Transmission, Fatigue, and Technological Laboratory Departments at Leonardo Helicopters. We thank them all. In particular, we would like to acknowledge Piermaria Davoli, Giuseppe Gasparini, Edoardo Conrado, Mauro Filippini. Special thanks go to the late Francesco Rosa, to whom this work is dedicated.
References
U. Mariani, R. Molinaro, S. Sartori, G. Gasparini, and C. Gorla, “Improvements in fatigue evaluations of helicopter transmissions,” ICAF 2011 Structural Integrity: Influence of Efficiency and Green Imperatives—Proceedings of the 26th Symposium of the International Committee on Aeronautical Fatigue, pp. 959–969, 2011, doi: 10.1007/978-94-007-1664-3_72/COVER.
S. Rustici, U. Mariani, F. Montagna, N. Motta, C. Gorla, and F. Rosa, “Fatigue of rotorcraft gears: Overview and prospects of improvement,” in 45th European Rotorcraft Forum 2019, ERF 2019, 2019, pp. 1277–1288.
G. Gasparini, U. Mariani, C. Gorla, M. Filippini, and F. Rosa, “Bending fatigue tests of helicopter case carburized gears: Influence of material, design and manufacturing parameters (08FTM11),” in American Gear Manufacturers Association—Fall Technical Meeting 2008, pp. 131–142.
G. Gasparini, U. Mariani, C. Gorla, M. Filippini, and F. Rosa, “Bending fatigue tests of helicopter case carburized gears: Influence of material, design and manufacturing parameters,” Gear Technology, November/December, pp. 68–76, 2009.
Cerrini et al., “Bending Fatigue Tests of Helicopter Case Carburized Gears: Influence of Material, Design and Manufacturing Parameters,” in International Conference on Gears 2010, Garching bei München (D), 2010, pp. 563–574.
Gorla, F. Rosa, and E. Conrado, “Bending Fatigue Strength of Case Carburized and Nitrided Gear Steels for Aeronautical Applications,” International Journal of Applied Engineering Research, Vol. 12, pp. 11306–11322, 2017
G. Niemann and H. Winter, “Getriebe allgemein, Zahnradgetriebe–Grundlagen, Stirnradgetriebe. Maschinenelemente, Vol. 2,” 2002.
L. Bonaiti and C. Gorla, “Estimation of gear SN curve for tooth root bending fatigue by means of maximum likelihood method and statistic of extremes,” Int J Fatigue, Vol. 153, p. 106451, Dec. 2021, doi: 10.1016/J.IJFATIGUE.2021.106451.
L. Bonaiti, M. Monti, M. Geitner, T. Tobie, C. Gorla, and K. Stahl, “On the usage of pulsator data within the load spectra assessment of gears,” Int J Fatigue, Vol. 181, p. 108145, Apr. 2024, doi: 10.1016/j.ijfatigue.2024.108145.
H. Rettig, “Ermittlung von Zahnfußfestigkeitskennwerten auf Verspannungsprüfständen und Pulsatoren-Vergleich der Prüfverfahren und der gewonnenen Kennwerte,” antriebstechnik, Vol. 26, No. 1, pp. 51–55, 1987.
D. R. McPherson and S. B. Rao, “Methodology for translating single-tooth bending fatigue data to be comparable to running gear data,” Gear Technology, March/April 2008, pp. 42–51.
J. B. Seabrook and D. W. Dudley, “Results of a Fifteen-Year Program of Flexural Fatigue Testing of Gear Teeth,” Journal of Engineering for Industry, Vol. 86, No. 3, pp. 221–237, Aug. 1964, doi: 10.1115/1.3670516.
K. Stahl, K. Michaelis, and B.-R. Höhn, “FVA research project 304, final report no. 580 – Life time statistics – Statistical methods for estimation of the machine element life time and reliability, and exemplary application on gears (German: Lebensdauerstatisktik - Statistische Methoden zur Beurteilung von Bauteillebensdauer und Zuverlässigkeit und ihre beispielhafte Anwendung auf Zahnräder),” FVA-Forschungsheft, 1999.
E. Wildhaber, “Measuring tooth thickness of involute gears,” Amer. Mach., Vol. 59, p. 551, 1923.
R. W. Buenneke, M. B. Slane, C. R. Dunham, M. P. Semenek, M. M. Shea, and J. E. Tripp, “Gear Single Tooth Bending Fatigue Test,” SAE Transactions, Vol. 91, pp. 3266–3274, 1982.
Hong, Z. Teaford, and A. Kahraman, “A comparison of gear tooth bending fatigue lives from single tooth bending and rotating gear tests,” Forschung im Ingenieurwesen/Engineering Research, 2021, doi: 10.1007/S10010-021-00510-W.
T. J. Lisle, C. P. Little, C. J. Aylott, and B. A. Shaw, “Bending fatigue strength of aerospace quality gear steels at ambient and elevated temperatures,” Int J Fatigue, p. 107125, Jul. 2022, doi: 10.1016/J.IJFATIGUE.2022.107125.
SAE, J1619_201712: Single Tooth Gear Bending Fatigue Test – SAE International. 2017.
L. Bonaiti, M. Geitner, T. Tobie, C. Gorla, and K. Stahl, “A Comparison between Two Statistical Methods for Gear Tooth Root Bending Strength Estimation Starting from Pulsator Data,” Applied Sciences, Vol. 13, No. 3, 2023, doi: 10.3390/app13031546.
European Union Aviation Safety Agency, Easy Access Rules for Large Rotorcraft (CS-29). EASA, 2025.
Printed with permission of the copyright holder, the American Gear Manufacturers Association, 1001 N. Fairfax Street, 5th Floor, Alexandria, Virginia 22314. Statements presented in this paper are those of the authors and may not represent the position or opinion of the American Gear Manufacturers Association.